Page 225 - The Geological Interpretation of Well Logs
P. 225

-  IMAGE  LOGS  -


                                  N          E

                                  }
                              E.G ||            ue
                                  |

                              28.15 |         WES
                                  t        ia
                                  |        at
                                  |           |
                              Soo  |f        2
                                  |   Lf-
                                  |  ya          \
                                                     =
                              99.2 ||  _     4   =  5
                                              ~
                                  |  rs          <

                               9.4   L       F   =   8
                                      ee
                                              ™
                              22:6:||       ‘ee   —S
                                            4
                                   |  |        ee
                                   |       fh
                              92.8        ek  —
                                                                                 :   LITHOLOGY

                              HL  |        er
                            =
                            -                iene
                            ©
                            3
                                                                    —              MARL
                              O02            i      Z                   zi
                                                                                 a
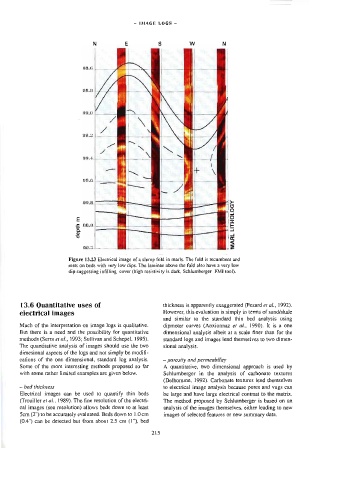
                         Figure  13.23  Electrical  image  of  a  slump  fold  in  marls.  The  fold  is  recumbent  and
                         rests  on  beds  with  very  low  dips.  The  Jaminae  above  the  fold  also  have  a  very  low
                         dip  suggesting  infilling  cover  (high  resistivity  is  dark,  Schlumberger  FMI  tool).


        13.6  Quantitative  uses  of                      thickness  is  apparently  exaggerated  (Pezard  er  al.,  1992).
        electrical  images                                However,  this  evaluation  is  simply  in  terms  of  sand/shale
                                                          and  similar  to  the  standard  thin  bed  analysis  using
        Much  of  the  interpretation  on  image  logs  is  qualitative.   dipmeter  curves  (Anxionnaz  ef  a/.,  1990}.  It  is  a  one
        But  there  is  a  need  and  the  possibility  for  quantitative   dimensional  analysis  albeit  at  a  scate  finer  than  for  the
        methods  (Serra  et  ai.,  1993;  Sullivan  and  Schepe],  1995).   standard  logs  and  images  lend  themse!ves  to  two  dimen-
        The  quantitative  analysis  of  images  should  use  the  two   sional  analysis.
        dimesional  aspects  of  the  logs  and  not  simply  be  modifi-
        cations  of  the  one  dimensional,  standard  log  analysis.   —  porosity  and  permeability
        Some  of  the  more  interesting  methods  proposed  so  far   A  quantitative,  two  dimensional  approach  is  used  by
        with  some  rather  limited  examples  are  given  below.   Schlumberger  in  the  analysis  of  carbonate  textures
                                                          (Dethomme,  1992).  Carbonate  textures  lend  themselves
        —  bed  thickness                                 to  electrical  image  analysis  because  pores  and  vugs  can
        Electrical  images  can  be  used  to  quantify  thin  beds   be  large  and  have  large  electrical  contrast  to  the  matrix.
        (Trouiller  et  a/.,  1989).  The  fine  resolution  of  the  electri-   The  method  proposed  by  Schlumberger  is  based  on  an
        cal  images  (see  resolution)  allows  beds  down  to  at  least   analysis  of  the  images  themselves,  either  leading  to  new
        5cm  (2")  to  be  accurately  evaluated.  Beds  down  to  1.0m   images  of  selected  features  or  new  summary  data.
        (0.4")  can  be  detected  but  from  about  2.5  cm  (1”),  bed

                                                      215
   220   221   222   223   224   225   226   227   228   229   230