
Page 220 - The Geological Interpretation of Well Logs
P. 220
- THE GEOLOGICAL INTERPRETATION OF WELL LOGS -
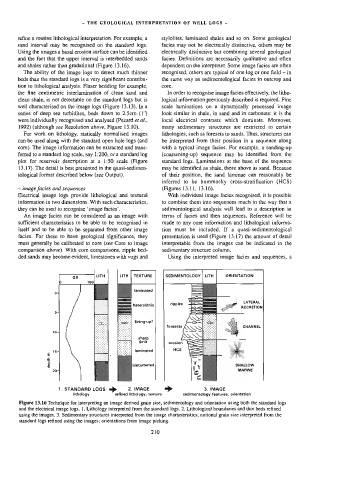
refine a routine lithological interpretation. For example, a stylolites, laminated shales and so on. Some geological
sand interval may be recognised on the standard logs. facies may not be electrically distinctive, others may be
Using the images a basal erosion surface can be identified electrically distinctive but combining several geological
and the fact that the upper interval is interbedded sands facies. Definitions are necessarily qualitative and often
and shales rather than gradational (Figure 13.16). dependent on the interpreter. Some image facies are often
The ability of the image logs to detect much thinner recognised, others are typical of one log or one field — in
beds than the standard logs is a very significant contribu- the same way as sedimentological facies in outcrop and
tion to lithological analysis. Flaser bedding for example, core.
the fine centimetric interlamination of clean sand and In order to recognise image facies effectively, the litho-
clean shale, is not detectable on the standard logs but is logical information previously described is required. Fine
well charactensed on the image logs (Figure 13.13). Ina scale laminations on a dynamically processed image
series of deep sea turbidites, beds down to 2.5em (1”) look similar in shale, in sand and in carbonate: it is the
were individually recognised and analysed (Pezard e7 ai., local electrical contrasts which dominate. Moreover,
1992) (although see Resolution above, Figure 13.10). many sedimentary structures are restricted to certain
For work on lithology, statically normalised images lithologies, such as foresets to sands. Thus, structures can
can be used along with the standard open hole logs (and be interpreted from their position in a sequence along
core). The image information can be extracted and trans- with a typical image facies. For example, a sanding-up
ferred to a standard log scale, say 1:200, or a standard log (coarsening-up) sequence may be identified from the
plot for reservoir description at a 1:50 scale (Figure standard logs. Laminations at the base of the sequence
13.17). The detail is best presented in the quasi-sedimen- may be identified as shale, those above as sand. Because
tological format described below (see Output). of their position, the sand laminae can reasonably be
inferred to be hummocky cross-stratification (HCS)
~ image facies and sequences (Figures 13.11, 13.16).
Electrical image logs provide lithological and textural With individual image facies recognised, it is possible
information in two dimensions: With such characteristics, to combine them into sequences much in the way that a
they can be used to recognise ‘image facies’. sedimentological analysis will lead to a description in
An image facies can be considered as an image with terms of facies and then sequences. Reference will be
sufficient characteristics to be able to be recognised in made to any core information and lithological informa-
itself and to be able to be separated from other image tion must be included. If a quasi-sedimentological
facies. For these to have geological significance, they presentation is used (Figure 13.17) the amount of detail
must generally be calibrated to core (see Core to image interpretable from the images can be indicated in the
comparison above). With core comparisons, ripple bed- sedimentary structure column.
ded sands may become evident, limestones with vugs and Using the interpreted image facies and sequences, a
SEDIMENTOLOGY | LITH ORIENTATION
LITH | TEXTURE
laminated
1
LATERAL
:
heterolithic ripples 3 oF ACCRETION
a
‘| fining-up?
forasets A\\ \s} SA\\| CHANNEL
sharp
limit erosion
Ee | \ PRES Loe -| laminated HCS
MARINE
£
=
a .
SHALLOW
3 bioturbated
1. STANDARD LOGS mp —.2. IMAGE > 3. IMAGE
lithology refined lithology, texture sedimentology features. orientation
Figure 13.16 Technique for interpreting an image derived grain size, sedimentology and orientation using both the standard logs
and the electrical image logs. 1. Lithology interpreted from the standard logs, 2. Lithologicad boundaries and thin beds refined
using the images. 3. Sedimentary structures interpreted from the image characteristics; notional grain size interpreted from the
standard logs refined using the images; orientations from image picking.
210