
Page 216 - The Geological Interpretation of Well Logs
P. 216
- THE GEGLOGICAL INTERPRETATION OF WELL LOGS -
EFFECTIVE INTERPRETATION
SIZE RANGE
0.1
L
qT mn T
OImm 0-Smmimm ome jicm 5em 10cm 50cm im Sm 10m
1 t a 14 14 {41
GRAIN SIZE Sn ed pebble | cobble | boulder
BEDS MLL Le laminae “A/S S/S /A thin [me thick | v. thick
CROSS-BED ripples mega ripples sand waves
{---
{ ,- KH —
THICKNESS equacus _ Hes scs_ _ _aeoltan dunes
bioturbation
STRUCTURES —— OO to 600m
a
ee
Ee
el
ee
pixel size 0.25cem i Scm, true bed thickness
THRESHOLDS
button size 0.4cm > 2.5m, beds and ripples recognised
button resolution = 0.5¢m >1.3cem, conglomerate recognised
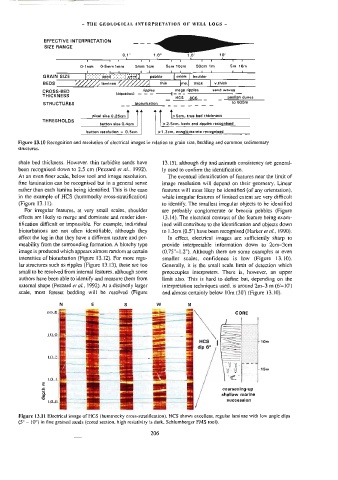
Figure 13.10 Recognition and resolution of electrical images in relation to grain size, bedding and common sedimentary
siructures,
shale bed thickness. However. thin turbidite sands have 13.15), although dip and azimuth consistency are general-
been recognised down to 2.5 cm (Pezzard er ai., 1992). ly used to confirm the identification.
Atan even finer scale, below tool and image resolution, The eventual identification of features near the limit of
fine lamination can be recognised but in a general sense image resolution will depend on their geometry. Linear
rather than each lamina being identified. This is the case features wiil most likey be identified (of any orientation),
in ihe example of HCS (hummocky cross-stratification) while irregular features of limited extent are very difficult
(Figure 13.1). to identify. The smallest irregular objects to be identified
For irregular features, at very small scales, shoulder are probably conglomerate or breccia pebbles (Figure
effects are likely to merge and dominate and render iden- 13.14). The electrical contrast of the feature being exam-
tification difficult or impossible. For example, individual ined will contribute to the identification and objects down
bioturbations are not often idenufiable, although they to 1,3cm (0.5") have been recognised (Harker et ai., 1990).
affect the log in that they have a different texture and per- In effect, electrical images are sufficiently sharp to
meability from the surrounding formation. A blotchy type provide interpretable information down to 2cm-—3cm
image is produced which appears almost random at certain (0.75"-1.2"). Although there are some examples al even
intensities of bioturbation (Figure 13.12). For more regu- smaller scales, confidence is low (Figure 13.10).
lar suuctures such as ripples (Figure 13.13), these are 100 Generally, it is the small scale limit of detection which
small to be resolved from internal features, although some preoccupies interpreters. There is, however, an upper
authors have been able to identify and measure them from limit aiso. This is hard to define but, depending on the
external shape (Pezzard e7 al., 1992). Ata distinctly larger interpretation techniques used, is around 2m—-3 m (6—10')
scale, most foreset bedding will be resolved (Figure and almost certainly below 10m (30°) (Figure 13.10).
| shallow marine
coarsening-up
succession
Figure 13.11 Electrical image of HCS (hummocky cross-stratification), HCS shows excellent, regular laminae with low angle dips
(5° - 10°) in fine grained sands (cored section, high resistivity is dark, Schlumberger FMS tool).
206