
Page 211 - The Geological Interpretation of Well Logs
P. 211
- IMAGE LOGS -
N E s Ww N DIP—>
m = wn W o 30 180 270 360 «=O* 60°
|
dipping bed ~~
dip azimuth
=low point
: ™~ tangent = dip angle D>
a ~--> oo
horizontal bed
A. Borehole B. Image - ‘unwrapped’ borehole C. Dipmeter
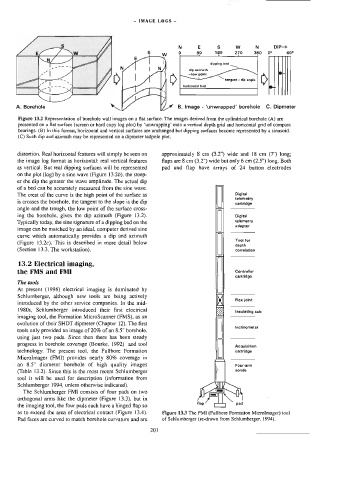
Figure 13.2 Representation of borehole wall images on a flat surface. The images derived from the cylindrical borehole (A) are
presented on a flat surface (screen or hard copy log plot) by ‘unwrapping’ onto a vertical depth grid and horizontal grid of compass
bearings. (B) In this format, horizontal and vertical surfaces are vachanged but dipping surfaces become represented by a sinusoid.
(C) Such dip and azimuth may be represented on a dipmeter tadpole plot.
distortion. Real horizontal features will simply be seen on approximately 8 cm (3.2”) wide and 18 cm (7") long;
the image log format as horizontal: real vertical features flaps are 8 cm (3.2") wide but only 6 cm (2.5") long. Both
as vertical. But real dipping surfaces will be represented pad and flap have arrays of 24 button electrodes
on the plot (log) by a sine wave (Figure 13.25), the steep-
er the dip the greater the wave amplitude. The actual dip
of a bed can be accurately measured from the sine wave.
The crest of the curve is the high point of the surface as Digital
telametry
is crosses the borehole, the tangent to the slope is the dip
cartridge
angle and the trough, the low point of the surface cross-
ing the borehole, gives the dip azimuth (Figure 13.2). Digital
Typically today, the sine signature of a dipping bed on the telemetry
adapter
image can be matched by an ideal, computer derived sine
curve which automatically provides a dip and azimuth
Tool for
(Figure 13.2c). This is described in more detail below
depth
(Section 13.3, The workstation). correlation
Me
13.2 Electrical imaging,
cartridge
the FMS and FMI Controller
The tools
At present (1996) electrical imaging is dominated by
Schlumberger, although new tools are being actively
Flex joint
introduced by the other service companies. In the mid-
1980s, Schiumberger introduced their first electrical
trsulating sub
imaging tool, the Formation MicroScanner (FMS), as an
Microlmager (FMI) provides nearly 80% coverage in inclinometer
evolution of their SHDT dipmeter (Chapter 12). The first
tools only provided an image of 20% of an 8.5” borehole,
using just two pads. Since then there has been steady
progress in borehole coverage (Bourke, 1992) and tool
Acquisition
technology. The present tool, the Fulfbore Formation
“an 8.5" diameter borehole of high quality images cartridge
Four-arm
(Table 13.2). Since this is the most recent Schlumberger sonde
tool it will be used for description (information from
Schlumberger 1994, unless otherwise indicated).
The Schlumberger FMI consists of four pads on two
=
orthogonal arms like the dipmeter (Figure 13.3), but in
flap [ 1 pad
the imaging tool, the four pads each have a hinged flap so
as to extend the area of electrical contact (Figure 13.4). Figure 13.3 The FMI (Fullbore Formation Microlmager) too)
Pad faces are curved to match borehole curvature and are of Schlumberger (re-drawn from Schlumberger, 1994).
201