
Page 214 - The Geological Interpretation of Well Logs
P. 214
— THE GEOLOGICAL INTERPRETATION OF WELL LOGS -
1. STATIC NORMALISATION 13.3 Electrical image interpretation,
—» data from entire well some generalities
frequency The workstation, dip and azimuth measurement
Interpretation of the electrical images (and acoustic) is
today accomplished on a workstation and not on paper
copy as previously. Initially, workstation facilities for
interactive image interpretation were not widely avail-
resistivity
able, but are now reasonably commonplace and routines
sufficiently simpte to be undertaken on a PC. Necessarily,
pixel calour scale
image manipulation facilities are linked to overall pro-
cessing. But although the processing stage and the
2. DYNAMIC NORMALISATION
interpretation stage have a fuzzy boundary, their objec-
tives are different and hence routines are different.
>
a selected data ‘window’ The first objective of workstation interpretation is the
¢
v NN dip and azimuth measurement of planar features. The
=]
oT
» image data are displayed on screen in the unwrapped
borehole format (Figure 13.2). As explained, with this
=
—
format, horizontal surfaces appear flat but dipping
surfaces appear as a sine wave, the amplitude indicating
pixel colour scale the dip, the position of the low point of the wave, the dip
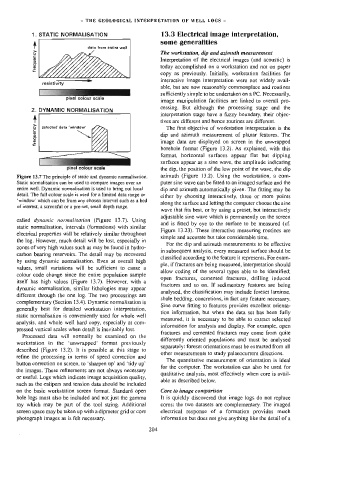
Figure 13.7 The principle of static and dynamic normalisation. azimuth (Figure 13.2). Using the workstation, a com-
Static normalisation can be used to compare images over an puter sine wave can be fitted to an imaged surface and the
entire well. Dynamic normalisation is used to bring out local dip and azimuth automatically given. The fitting may be
detail. The full colour scale is used for a limited data range or
either by choosing interactively, three or more points
‘window’ which can be from any chosen interval such as a bed
along the surface and letting the computer choose the sine
of interest, a screenful or a pre-set, small depth range.
wave that fits best, or by using a preset, but interactively
adjustable sine wave which is permanently on the screen
called dynamic normalisation (Figure 13.7). Using
and is fitted by eye to the surface to be measured (cf.
static normalisation, intervals (formations) with similar
Figure 13.23), These interactive measuring routines are
electrical properties will be relatively similar throughout
simple and accurate but take considerable time.
the log. However, much detail will be lost, especially in
For the dip and azimuth measurements to be effective
zones of very high values such as may be found in hydro-
in subsequent analysis, every measured surface should be
carbon bearing reservoirs. The detail may be recovered
classified according to the feature it represents. For exam-
by using dynamic normalisation. Even at overall high
ple, if fractures are being measured, interpretation should
values, small variations will be sufficient to cause a
allow coding of the several types able to be identified;
colour code change since the entire population sample
open fractures, cemented fractures, drilling induced
itself has high values (Figure 13.7). However, with a
fractures and so on. Jf sedimentary features are being
dynamic normalisation, similar tithologies may appear
analysed, the classification may include foreset laminae,
different through the one log. The two processings are
shale bedding, concretions, in fact any feature necessary.
complementary (Section 13.4). Dynamic normalisation is
Sine curve fitting to features provides excellent orienta-
generally best for detailed workstation interpretation,
tion information, but when the data set has been fully
Static normalisation is conveniently used for whole well
measured, it is necessary to be able to extract selected
analysis, and whole well hard copy, especially at com-
information for analysis and display. For example, open
pressed vertical scales when detail is inevitably lost.
fractures and cemented fractures may come from quite
Processed data will normally be examined on the
differently oriented populations and must be analysed
workstation in the ‘unwrapped’ format previously
separately: foreset orientations must be extracted from all
described (Figure 13.2). It is possible at this stage to
other measurements to study palaeocurrent directions.
refine the processing in terms of speed correction and
The quantitative measurement of orientation is ideal
button correction on screen, to ‘sharpen up’ and ‘tidy up’
for the computer. The workstation can also be used for
the images. These refinements are not always necessary
qualitative analysis, most effectively when core is avail-
or useful. Logs which indicate image acquisition quality,
able as described below.
such as the calipers and tension data should be included
on the basic workstation screen format. Standard open Core to image comparison
hole logs must also be included and not just the gamma It is quickly discovered that image logs do not replace
ray which may be part of the tool string. Additional cores: the two datasets are complementary. The imaged
screen space may be taken up with a dipmeter grid or core electrical response of a formation provides much
photograph images as is felt necessary. information but does not give anything like the detail of a
204