
Page 215 - The Geological Interpretation of Well Logs
P. 215
- [IMAGE LOGS -
core photos to be displayed on the screen and moved at
borehole
will to a position over the appropriate image site.
borehole axis core slab
fimags) (photo) However, even this is often difficult, as the photo is of a
slab from the centre of the borehole, while the image is
from around the borehole wall thus causing depth mis-
matches (Figure 13.8). Moreover, the orientation of the
core slab is quite likely 1o change from core piece to core
ee depth piece.
difference
depth i“ cuter
Image resolution and identification
differance ——_-1 7 ms: The resolution of individual FMI buttons is indicated at
Me RS ip 0.2" {0.5 cm) which is also the effective electrode size
pS difference (Schlumberger, 1994). Signa] penetration is around 1.4
we
cm (Bourke, 1993) but varies. However, in terms of the
images produced, because of tool design and log sam-
pling rate, the formation is sampled horizontally and
Figure 13.8 Illustration of the difficulties of matching core
vertically every 0.1° (0.25 cm) (Section 13.2, Figure
photos to borehole images.
13.4). Pixels of 0.1" X 0.1” (0.25 em X 0.25 cm) are used
for image creation, that is, half the individual electrode
visual response, and moreover must be interpreted like
resolution. Features the size of a pixel wil] not be
any resistivity log in terms of formation electrical charac-
resolved, i.e. will not be separated. Features smaller than
teristics.
a pixel will appear pixel sized. When considering the
Comparison between core and image is inevitable and
images themselves (not the individual electrodes) it is
necessary but image and core will not be similar. It is like
the ability to be able to recognise an object which is
comparing an X-ray of a body to the body itself: like are
important. How small an object can be recognised on the
not being compared. At best, the log response to individ-
images? This is difficult to define scientifically and it is
ual features such as fractures or foresets can be directly
essentially through use that we find out,
observed. The features are recognisably resolved. But
many features are not fully resolved (see below, log reso- 10 L he.
lution), and an ‘image facies’ technique is used to infer
$4
them. For example, bioturbation is usually not resolved
£ ad ae” & a
as recognisable, separate features on the images, but S Fe -
. x .
does cause a typical ‘look’ on the log responses. These
@? Ko
o c .
are sufficiently distinctive to be able to be recognised € L
x 6 a
over useful intervals of log. That is, they can be recog- 2 °
si oa Qo .
nised as an ‘image facies’ which is similar both over
cored intervals and beyond, and can be used to make a Ss 44 a a
w o
quasi-sedimentological interpretation.
o 3 os r
Recognising image facies is best undertaken using the a = 8.
ao ’
€ 2; a S&S -
workstation and requires the use of core photos (which
may be put on the screen, see below), sedimentological 6 5
i,
logs and the standard logs at a minimum. Care needs +——— r . r T T T T
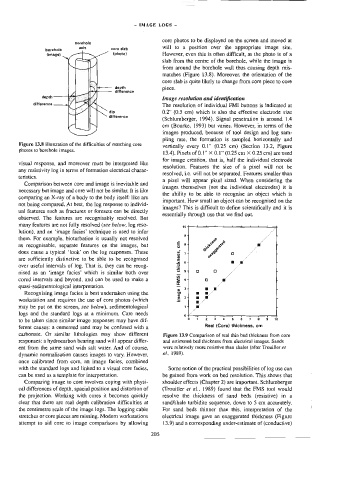
1 2 3 4 5 6 7 6 3 10
to be taken since similar image responses may have dif-
Real {Core} thickness, cm
ferent causes: a cemented sand may be confused with a
carbonate. Or similar lithologies may show different Figure 13.9 Comparison of real] thin bed thickness from core
responses: a hydrocarbon bearing sand will appear differ- and estimated bed thickness from electrical images. Sands
ent from the same sand with salt water. And of course, were relatively more resistive than shales (after Trouiller es
dynamic normalisation causes images to vary. However, al,, 1989).
once calibrated from core, an image facies, combined
with the standard logs and linked io a visual core facies, Some notion of the practical possibilities of log use can
can be used as a template for interpretation. be gained from work on bed resolution. This shows that
Comparing image to core involves coping with physi- shoulder effects (Chapter 2) are important. Schlumberger
ca] differences of depth, spacial position and distortion of (Trouiller ef al., 1989) found that the FMS tool would
the projection. Working with cores it becomes quickly resolve the thickness of sand beds (resistive) in a
clear that there are real depth calibration difficulties at sand/shale turbidite sequence, down to 5 cm accurately.
the centimetre scale of the image logs. The logging cable For sand beds thinner than this, interpretation of the
stretches or core pieces are missing. Modern workstations electrical image gave an exaggerated thickness (Figure
attempt to aid core to image comparisons by allowing (3.9) and a corresponding under-estimate of (conductive)
205