
Page 217 - The Geological Interpretation of Well Logs
P. 217
- IMAGE LOGS -
N
ss |
1\
\ lamination and
bioturbation
7m
carbonate!
_ cemented’
¥
| layer
|
eas _|pioturdatio
gar | nodule offshore marine 80m
+
| carbonate
.
shale succession
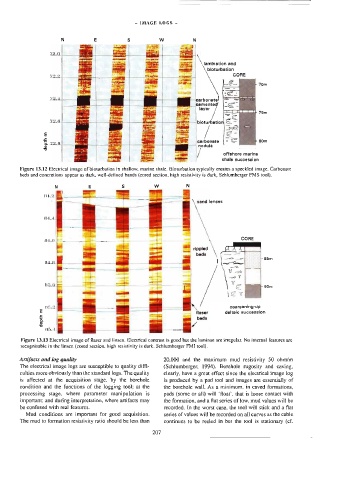
Figure 13.12 Ejecirical image of bioturbation in shallow, marine shale. Biowurbation typically creates a speckled image. Carbonate
beds and concretions appear as dark, well-defined bands (cored section, high resistivity is dark, Schlumberger FMS tool).
N
q
7 : \r" lenses
\
\
= rippled
ai beds
\ coarsening-up
m tlaser deftaic succession
depth beds
Figure 13.13 Electrical image of fiaser and linsen, Electrical contrast is good but the laminae are irregular. No internal features are
recognisable in the linsen (cored section, high resistivity is dark. Schlumberger FMI tool).
Artifacts and log quality 20,000 and the maximum mud resistivity 50 ohm/m
The elecinical image logs are susceptible to quality diffi- (Schlumberger, 1994). Borehole rugosity and caving,
culties more obviously than the standard logs. The quality clearty, have a great effect since the electrical image log
is affected at the acquisition stage. by the borehole is produced by a pad tool and images are essenually of
condition and the functions of the logging tool; at the the borehole wall. As a minimum, in caved formations,
processing stage, where parameter manipulation is pads (some or ali) will ‘float’, that is loose contact with
important; and during interpretation, where artifacts may the formation, and a flat series of low, mud values will be
be confused with real features. recorded. In the worst case, the too] will stick and a flat
Mud conditions are important for good acquisition. series of values wil] be recorded on al] curves as the cable
The mud to formation resistivity ratio should be less than continues to be reeled in but the tool is stationary (cf.
207