
Page 218 - The Geological Interpretation of Well Logs
P. 218
- THE GEOLOGICAL INTERPRETATION OF WELL LOGS -
pad orientation cope with are pads that collect cuttings or lumps of
detatched formation and drag them along while logging
10 70 130 190 260 410 £0
(Bourke, 1989). Fuzzy images and poor data zones run-
ning more or fess vertically up the image are created.
am
Less obvious afe those jog artifacts which are a result
of the way that the images are acquired. For example, in
intervals where mud cake is thick (over 1.2em), images
may come from the mudcake or irregulanties in the mud-
cake. This is especially true where a previous tool has left
pad traces in the cake or logging cable rub has made a
groove. Generally, these features will be recognised as
they continue vertically for some distance or spiral up the
and examples
images. Detailed discussions of artifacts are found in
published fiterature (i.e. Bourke, 1989; Serra, 1989).
13.4 Electrical image sedimentary
18.6 4 interpretation, some concepts
metres
18.8 4 From a sedimentary and sedimentological point of
view, electrical images are used to identify sedimentary
1 structures and features, measure sedimentary orientation
and give detailed information on lithology, texture and
The sedimentary interpretation of electrical image logs
19.0) ee sedimentary facies and sequences.
tends to follow routines similar to those used in a purely
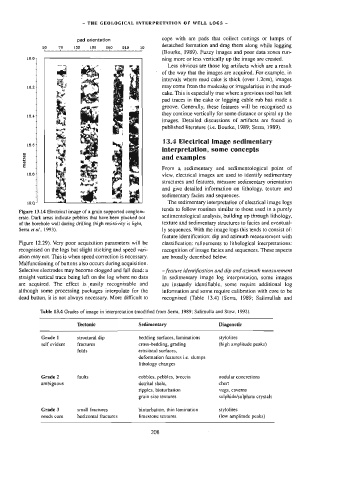
Figure 13.14 Electrical image of a grain supported conglom-
sedimentological analysis, building up through lithology,
erate. Dark areas indicate pebbles that have been plucked ont
of the borehole wal! during drilling (high resistivity is light, texture and sedimentary structures to facies and eventual-
Serra ef ai., 1993). ly sequences. With the image logs this tends to consist of:
feature identification: dip and azimuth measurement with
Figure 12.29). Very poor acquisition parameters will be classification: refinements to lithological interpretations:
recognised on the logs but slight sticking and speed vari- recognition of image facies and sequences. These aspects
ation may not. This is when speed correction is necessary. are broadly described below.
Malfunctioning of buttons also occurs during acquisition.
Selective electrodes may become clogged and fall dead: a — feature identification and dip and azimuth measurement
straight vertical trace being left on the log where no data In sedimentary image log interpretation, some images
are acquired. The effect is easily recognisable and are instantly identifiable, some require additional log
although some processing packages interpolate for the information and some require calibration with core to be
dead button, it is not always necessary. More difficult to recognised (Table 13.4) (Serra, 1989; Salimullah and
Table 13.4 Grades of image in interpretation (modified from Serra, 1989; Salimulla and Stow, 1992).
Tectonic Sedimentary Diagenetic
Grade 1 structural dip bedding surfaces, laminations stylolites
self evident fractures cross-bedding, grading (high amplitude peaks)
folds erosional surfaces,
deformation features i.e. slumps
lithology changes
Grade 2 faults cobbles, pebbles, breccia nodular concretions
ambiguous detrital shale, chert
ripples, bioturbation vugs, cavems
grain size textures sulphide/sulphate crystals
Grade 3 small] fractures bioturbation, thin lamination stylolites
needs core horizontal fractures limestone textures (low amplitude peaks)