
Page 219 - The Geological Interpretation of Well Logs
P. 219
- IMAGE LOGS -
Stowe, 1992). For example, foresets can usually be recog- account for surfaces positively recognised, such as fore-
nised from image characteristics alone, they show fine but sets, to those vaguely recognised such as ripple bedding
faint lamination and variable dip angles (Figure 13.15). and also unrecognised features (cf. Bourke, 1992). A
The internal structures of ripples, however, are generally numerical quality rating may be included from certain to
beyond the resolution of the tool (Figure 13.10) but doubtful.
rippie bedded facies once calibrated to core, may be As work progressses on an image log, so a more and
recognised outside cored intervals (Figure 13.13). more detailed picture is built up. For example, orientation
Finally, without cores it has been found impossible to data may allow an intervai 10 be identified as deposited in
differentiate between pebbles, mud clasts, concretions lateral accretion surfaces: mottled images identified as
and bioturbations (Salimullah and Stowe, 1992). Core debris flows and so on. This progressive building is
calibration is an important aspect of feature identification. implied in the following sections.
Beyond simple identification, the image logs allow the
measurement of sedimentary structure orientation using ~ lithology
ihe workstation, as described above (Section 3.3). For Lithological information will be needed at an early stage
these dip and azimuth data to be of most use, the feature of image interpretation outside cored intervals. Many
measured must be identified as foreset, sand bed, shale sedimentary features have lithological associations and
lamina, concretion, and so on. The classification will be electrical logs are not primary lithology indicators
used for subsequent filtering and, for example, foresets (Chapter 6). Lithological information must come from
will be extracted to provide palaeocurrent directions. The other sources, such as the neutron-density, gamma ray
identification of the causal features is, of course, subject logs and dril) cuttings. However, the image logs provide
to the difficulties outlined in the previous paragraph. very detailed textural information, can show thin beds
so that any classification must be sufficiently robust to and give accurate bed boundaries and so can be used to
—~—14°
70°
16°
4°
12°
m 13°
depth 8°
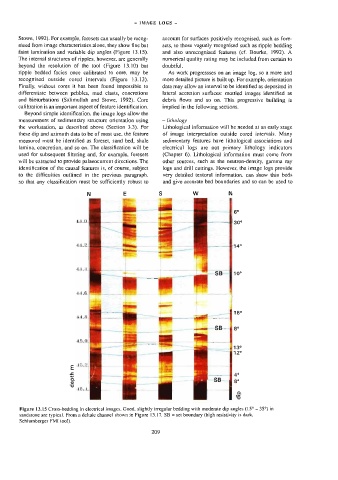
Figure 13.15 Cross-bedding in electrical images. Good, slightly irregular bedding with moderate dip angles (15° - 35°) in
sandstone are typical. From a deltaic channel shown ijn Figure 13.17. SB = set boundary (high resistivity is dark,
Schlumberger FMI tool).
209