
Page 208 - The Geological Interpretation of Well Logs
P. 208
- THE GEOLOGICAL INTERPRETATION OF WELL LOGS -
drilling mud. Normally, this anomaly will only be seen
TRANSVERSE
LONGITUDINAL
on one (at most two) of the curves. Thus, comparing the
gs
E
R
30°
normal resistivity at any level allows conductive anom-
alies to be detected, These are attributed to fractures and
38 may be given an orientation since the dipmeter pad bear-
ings are known. Although this was an interesting idea, its
32
application was full of problems from floating pads, poor
hole etc and the results never certain. Borehole imaging
34
tools now offer an excellent way of detecting fractures
36 (Chapter 13).
38
12.8 Conclusion
4a This chapter on dipmeter interpretation requires a con-
42 clusion. The dipmeter, an expensive tool to run, is stil] not
44 being used to its full extent. Interpretation is to blame.
Dipmeter interpretation is heavily dependent on the
Orientation Orientation
computer, for processing, formatting and manipulation.
355°-175° 265°-85°
Each step involves geologically biased choices, so it must
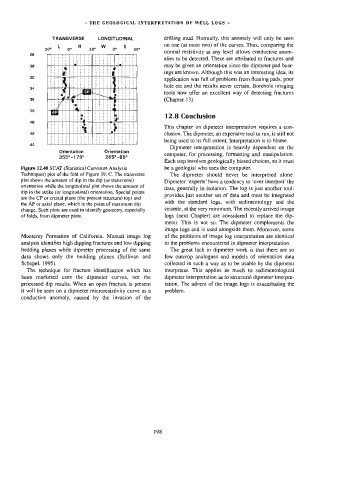
Figure 12.40 SCAT (Statistical Curvature Analysis be a geologist who uses the computer.
Techniques) plot of the fold of Figure 39, C. The transverse The dipmeter should never be interpreted alone.
plot shows the amount of dip in the dip (or transverse)
Dipmeter ‘experts’ have a tendency to ‘over interpret’ the
orientation while the longitudinal] plot shows the amount of
data, generally in isolation. The log is just another tool:
dip in the strike (or longitudinal) onentation. Special points
provides just another set of data and must be integrated
are the CP or crestal plane (the present structural top) and
with the standard logs, with sedimentology and the
the AP or axial plane, which is the point of maximum dip
change. Such plots are used to identify geometry, especially seismic, at the very minimum. The recently arrived image
of folds, from dipmeter pjots. logs (next Chapter) are considered to replace the dip-
meter. This is not so. The dipmeter complements the
image logs and is used alongside them. Moreover, some
Monterey Formation of California. Manual image log of the problems of image log interpretation are identical
analysis identifies high dipping fractures and low dipping to the problems encountered in dipmeter interpretation.
bedding planes while dipmeter processing of the same The great lack in dipmeter work is that there are so
data shows only the bedding planes (Sullivan and few outcrop analogues and models of orientation data
Schepel, 1995). collected in such a way as to be usable by the dipmeter
The technique for fracture identification which has interpreter. This applies as much to sedimentological
been marketed uses the dipmeter curves, not the dipmeter interpretation as to sicuctural dipmeter interpre-
processed dip results. When an open fracture is present tation. The advent of the image logs is exacerbating the
it will be seen on a dipmeter microresistivity curve as a problem.
conductive anomaly, caused by the invasion of the
198