
Page 204 - The Geological Interpretation of Well Logs
P. 204
- THE GEOLOGICAL INTERPRETATION OF WELL LOGS -
— distortion at the fault plane, fault drag are related to the distorting effects that faulting has on
It is generally assumed that faults can be recognised on the entire rock mass, not the distortion just around the
the dipmeter by tectonic drag. Drag forms as beds are fault itself. Moreover, rollover and reverse drag cause
pulled along a fault zone like a wet rag, as movement beds to dip éuzo a fault, not to parallel it (Figure 12.35).
progresses (Figure 12.35). This movement is considered (Although rollover is shown in the example (Figure
cylindrical, so that beds are rotated (dragged) progres- 12.35) as restricted to the hanging wall, this is not
sively into the plane of the fault as the fault itself is always the case. It is the case in listric faults — see
approached. A dipmeter through a zone of drag will show below). If a cusp pattern is identified on the dipmeter, it
a cusp pattern on the log (Figure 12.35a@) while the dips is essential to know whether it is drag and parallel to the
in the cusp, when plotted on a stereogram, will fall on a fault, or rollover/reverse drag and contrary to the fault.
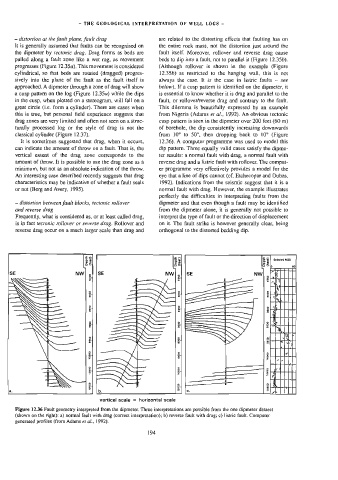
great circle (i.e. form a cylinder). There are cases when This dilernma is beautifully expressed by an example
this is true, but personal field experience suggests that from Nigeria (Adams er ai., 1992). An obvious tectonic
drag zones are very limited and often not seen on a struc- cusp pattern is seen in the dipmeter over 200 feet (60 m)
turally processed log or the style of drag is not the of borehole, the dip consistently increasing downwards
classical cylinder (Figure 12.37). from 10° to 50°, then dropping back to 10° (Figure
It is sometimes suggested that drag, when it occurs, 12.36). A computer programme was used to model this
can indicate the amount of throw on a fault. That is, the dip pattern. Three equally valid cases satisfy the dipme-
vertical extent of the drag zone corresponds to the ter results: a normal fault with drag, a normal fault with
amount of throw. It is possible to use the drag zone as a reverse drag and a listric fault with rollover. The comput-
minimum, but not as an absolute indication of the throw. er programme very effectively provides a model for the
An interesting case described recently suggests that drag eye that a line of dips cannot (cf. Etchecopar and Dubas,
characteristics may be indicative of whether a fault seals 1992). Indications from the seismic suggest that it is a
or not (Berg and Avery, 1995). normal fault with drag. However, the example illustrates
perfectly the difficulties in interpreting faults from the
- distortion between fault blocks, tectonic rollover dipmeter and that even though a fault may be identified
and reverse drag from the dipmeter alone, it is generally not possible to
Frequently, what is considered as, or at least called drag, interpret the type of fault or the direction of displacement
is in fact tectonic rollover or reverse drag. Rollover and on it. The fault strike is however generally clear, being
reverse drag occur on a much larger scale than drag and orthogonal] to the distorted bedding dip.
Depth (feet) Depth (feet)
J
SE NW SE NW
9750 9750
uae
N= $300
carer Hy 9950 9850 1
10000 i
|
wl 10050 1 b. G TT 10050
|
i
10100
4
40160 1
vertical scale = horizontal scale
Figure 12.36 Fault geometry interpreted from the dipmeter. Three interpretations are possible from the one dipmeter dataset
(shown on the right): a) normal fault with drag (correct interpretation); b) reverse fault with drag; ¢) listric fault. Computer
generated profiles (from Adams ef al., 1992).
194