
Page 200 - The Geological Interpretation of Well Logs
P. 200
- THE GEOLOGICAL INTERPRETATION OF WELL LOGS -
(Figure 12.29). For example, facies 5, flaser and linsen, 12.8 Structural dipmeter interpretation
shows strong electrical contrast between the discrete,
clean sand and clean shale layers. In facies a, laminated Structural dip: definition, processing
shale, electrical contrasts are much less pronounced. and identification
Although it is principally the microresistivity curve By structeral dip is intended the ‘general attitude of
characteristics that bring out facies information, the beds’. It is the dip that would be measured at outcrop. It
processed dipmeter results themselves are indirectly is usually the dip seen on seismic reflectors, themselves
affected. For example, although a bioturbated sandy shale a generalisation, [t avoids any sedimentary structures of
may show good electrical contrasts in the curves, there any size and is generally considered to represent the
is no curve similarity and the processed dips are poor, depositional surface which also is considered to be hori-
inconsistent and scattered (Figure 12.29c). Equally, the zontal. There are of course many exceptions where the
other two facies illustrated show the effects that the curve depositional surface is not horizontal (Figure 15.23).
characteristics have on the computed results, although it A dipmeter log is processed for structural dip with a
is only when the curves are plotted alongside the results relatively broad correlation interval, typically 1 m (3'
that it is possible to make a facies interpretation. or 4’) (Figure 12.18) (Bigelow, 1985). Step distance,
GAMMA |DEPTH AZIMUTH NEUTRON
DENSITY AZ.
oa 150, ™
3380
sd plnelerlas paso, Rul
ZY
3488
3529
3688
3788 b SS ~ = w ~ mb
/
\
3820 U7, N=e7] |
4000
Ss
°s £'] GP
aie 3989 a, “ disconformity Uj \N oe
SS
a
Ly,
be
’
,
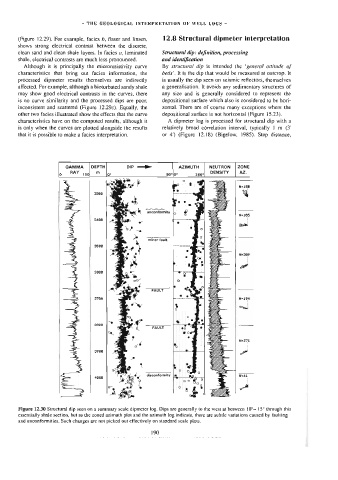
Figure 12.30 Structural dip seen on a summary scale dipmeter log. Dips are generally to the west at between 10°— 15° through this
essentially shale section, but as the zoned azimuth plot and the azimuth log indicate, there are subUle variations caused by faulting
and unconformities. Such changes are not picked out effectively on standard scale plots.
190