
Page 196 - The Geological Interpretation of Well Logs
P. 196
- THE GEOLOGICAL INTERPRETATION OF WELL LOGS -
2 Km 4 o 6
scale
N N D
j, /
j
channel j channel
palasocurrents palaeocurrents
from from
foraset dips foreset dips
j
ZL
SY
i, ©
4
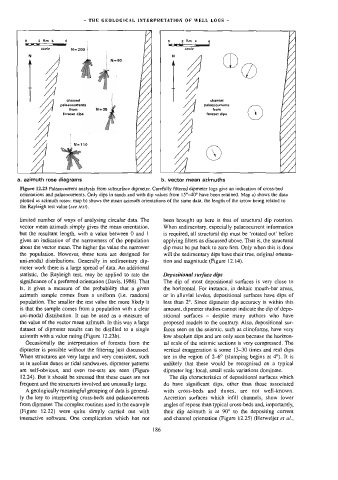
a. azimuth rose diagrams b. vector mean azimuths
Figure 12.23 Palaeocurrent analysis from subsurface dipmeter. Carefully filtered dipmeter logs give an indication of cross-bed
orientations and palaeocurrents. Only dips in sands and with dip values from 15°-40° have been retained. Map a) shows the data
plotted as azimuth roses; map b) shows the mean azimuth orientations of the same data, the length of the arrow being related to
the Rayleigh test value (see text).
limited number of ways of analysing circular data. The been brought up here is that of structural dip rotation.
vector mean azimuth simply gives the mean orientation, When sedimentary, especially palaeocurrent information
but the resultant length, with a value between O and 1 is required, all structural dip must be ‘rotated out’ before
gives an indication of the narrowness of the population applying filters as discussed above. That is, the structural
about the vector mean. The higher the value the narrower dip must be put back to zero first. Only when this is done
the population. However, these tests are designed for will the sedimentary dips have their true, original ortenta-
uni-modal] distributions, Generally in sedimentary dip- tion and magnitude (Figure 12.14).
meter work there is a large spread of data. An additional
statistic, the Rayleigh test, may be applied to rate the Depositional surface dips
significance of a preferred orientation (Davis, 1986). That The dip of most depositional surfaces is very close to
is, it gives a measure of the probability that a given the horizonial. For instance, in deltaic mouth-bar areas,
azimuth sample comes from a uniform (i.e. random) or in alluvial levées, depositional surfaces have dips of
population. The smaller the test value the more likely it less than 2°. Since dipmeter dip accuracy is within this
is that the sample comes from a population with a clear amount, dipmeter studies cannot indicate the dip of depo-
uni-modal distribution. It can be used as a measure of sitional surfaces -— despite many authors who have
the value of the vector mean azimuth. In this way a large proposed models to the contrary. Also, depositional sur-
dataset of dipmeter results can be distitled to a single faces seen on the seismic, such as clinoforms, have very
azimuth with a value rating (Figure 12.238). low absolute dips and are only seen because the horizon-
Occasionally the interpretation of foresets from the tal scale of the seismic sections is very compressed. The
dipmeter is possible without the filtering just discussed. vertical exaggeration is some 13-30 times and real dips
When structures are very large and very consistent, such are in the region of 2-6° (slumping begins at 4°). It is
as in aeolian dunes or tidal sandwaves, dipmeter patterns unlikely that these would be recognised on a typical
are self-obvious, and even toe-sets are seen (Figure dipmeter log: local, small scale variations dominate.
12.24). But it should be stressed that these cases are not The dip characteristics of depositional surfaces which
frequent and the structures involved are unusually large. do have significant dips, other than those associated
A geologically meaningful grouping of data is general- with cross-beds and dunes, are not well-known.
ly the key to interpreting cross-beds and palaeocurrents Accretion surfaces which infill channels, show lower
from dipmeter. The complex routines used in the example angles of repose than typical cross-beds and, importantly,
(Figure 12.22) were quite simply carried out with their dip azimuth is at 90° to the depositing current
interactive software. One complication which has not and channet orientation (Figure 12.25) (Herweijer er ai.,
186