
Page 191 - The Geological Interpretation of Well Logs
P. 191
- THE DIPMETER -
The solution people, a series of ‘tadpoles’ on a dipmeter grid does not
More than with the other open hole logs, the dipmeter suggest the geometric form that created them. A fold or
Tequires manipulation {in effect computer manipulation), fault is not recognisable from a line of dips. Choice of
before interpretation is possible. The manipulation is format includes the scale of display, the separation of dip
effectively a progressive series of choices which, in and azimuth and the choice of a format that attempts to
themselves, are already part of the interpretation process. actually reconstruct the geometry of the feature measured
Three principal choices are invloved: choice of process- by the dipmeter.
ing parameters: choice of post-processing data grouping: Post-processing data grouping is carried out on logs
choice of processed data format. What these choices already processed and provides a means of enhancing
imply is briefly explained immediately below while their useful data. As discussed, comparison with cores shows
effect on the data is illustrated in the examples through that poor dipmeter logs contain noise. Individual noise
the text. dips cannot be identified or eliminated in a subsurface
The division of dipmeter interpretation into the sedi- data set, but their effects may be significantly lessened
mentary and structural fields has been mentioned. The by grouping processed results: it allows valid data to
choice of processing parameters underlines this division. dominate (Cameron, 1986; 1992). For instance, for a
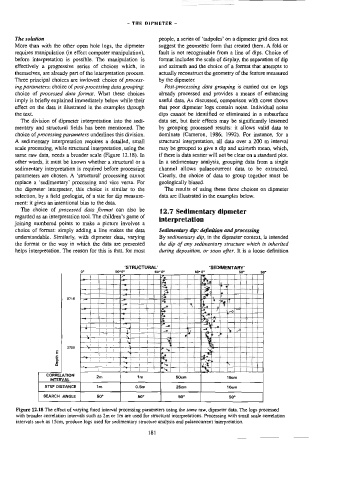
A sedimentary interpretation requires a detailed, small Structural interpretation, all data over a 200 m interval
scale processing, while structural interpretation, using the may be grouped to give a dip and azimuth mean, which,
same raw data, needs a broader scale (Figure 12.18). In if there is data scatter will not be clear on a standard plot.
other words, it must be known whether a structural or a In a sedimentary analysis, grouping data from a single
sedimentary interpretation is required before processing channel allows palaeocurrent data to be extracted.
parameters are chosen. A ‘structural’ processing cannot Clearly, the choice of data to group together must be
replace a ‘sedimentary’ processing and vice versa. For geologically biased.
the dipmeter interpreter, this choice is similar to the The results of using these three choices on dipmeter
selection, by a field geologist, of a site for dip measure- data are illustrated in the examples below.
ment: it gives an intentional bias to the data.
The choice of processed data format can also be
12.7 Sedimentary dipmeter
regarded as an interpretation tool. The children’s game of
interpretation
joining numbered points to make a picture involves a
choice of format: simply adding a line makes the data Sedimentary dip: definition and processing
understandable. Similarly, with dipmeter data, varying By sedimentary dip, in the dipmeter context, is intended
the format or the way in which the data are presented the dip of any sedimentary structure which is inherited
helps interpretation. The reason for this is that, for most during deposition, or soon after. It is a loose definition
‘STRUCTURAL’ ‘SEDIMENTARY’
9° 50°90 > §0* of Bo" o* Eo*
m
Depth
CORRELATION 2m
60cm
160m
0.5m
STEP DISTANCE
Im
10¢m
26cm
50°
SEARCH ANGLE
50°
50°
50°
Figure 12.18 The effect of varying fixed interval processing parameters using the same raw, dipmeter data. The logs processed
with broader correlation intervals such as 2m or Im are used for structural interpretations. Processing with small scale correlation
intervals such as 15cm, produce logs used for sedimentary structure analysis and palaeocurrent interpretation,