
Page 190 - The Geological Interpretation of Well Logs
P. 190
- THE GEOLOGICAL INTERPRETATION OF WELL LOGS -
SEARCH ANGLE = 60°
QUALITY FILTERS INCREASING §==—£-———————_}-
A. NO FILTERS Q=0.2-1.0 Cc. Q=0,6-1.0
Le 605 oor] oe 80) ao] lor 80", 90
de
Se
Sy
4
| | in * A
@
a
aa
702
r 8
1 3 + oe
te | F 4 L.
* oe
P | lah eh
goa + 3 5
é| |4 é *
R te
. ~
N
~s
’ me) «
98
P ? <
QUALITY: OPEN DIPS 0-0.4 FILLED DIPS: 0.5-1.0
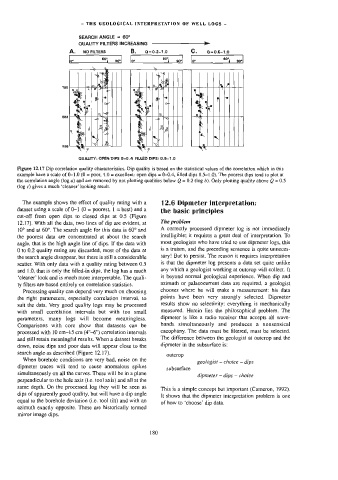
Figure 12.17 Dip correlation quality characteristics. Dip quality is based on the statistical values of the correlation which in this
example have a scale of 0-1.0 (0 = poor, 1.0 = excellent; open dips = 0-0.4, filled dips 0.5-1.0), The poorest dips tend to plot at
the correlation angle (log @) and are removed by not plotting qualities below Q = 0.2 (log 6). Only plotting quality above Q = 0.5
(log c) gives a much ‘cleaner’ looking result.
The example shows the effect of quality rating with a 12.6 Dipmeter interpretation:
dataset using a scale of O-] (0 = poorest, | = best) and a
the basic principles
cut-off from open dips to closed dips at 0.5 (Figure
The problem
12.17). With all the data, nwo lines of dip are evident, at
A correctly processed dipmeter log is not immediately
10° and at 60°. The search angle for this data is 60° and
the poorest data are concentrated at about the search intelligible; it requires a great deal of interpretation. To
angle, that is the high angle line of dips. If the data with most geologists who have tied to use dipmeter logs, this
0 to 0.2 quality rating are discarded, most of the data at is a truism, and the preceding sentence is quite unneces-
the search angle disappear, but there is still a considerable sary! But to persist. The reason it requires interpretation
scatter. With only data with a quality rating between 0.5 is that the dipmeter log presents a data set quite untike
any which a geologist working at outcrop will collect. It
and 1.0, that is only the filled-in dips, the log has a much
‘cleaner’ look and is much more interpretable, The quali- is beyond normal geological experience. When dip and
ty filters are based entirely on correlation statistics. azimuth or palaeocurrent data are required, a geologist
Processing quality can depend very much on choosing chooses where he will make a measurement: his data
points have been very strongly selected. Dipmeter
the right parameters, especially correlation interval, to
suit the data. Very good quality logs may be processed results show no selectivity: everything is mechanically
with small correlation intervals but with too small measured. Herein lies the philosophical problem. The
parameters, many logs will become meaningless. dipmeter is like a radio receiver that accepts all wave-
bands simultaneously and produces a nonsensical
Comparisons with core show that datasets can be
cacophany. The data must be filtered, must be selected.
processed with 10 cm-15 cm (4°-6") correlation intervals
and still retain meaningful results. When a dataset breaks The difference between the geologist at outcrop and the
dipmeter in the subsurface is:
down, noise dips and poor data will appear close to the
search angle as described (Figure 12.17).
outcrop
When borehole conditions are very bad, noise on the
geologist — choice — dips
dipmeter traces wil] tend to cause anomalous spikes
subsurface
simultaneously on all the curves. These will be in a plane
dipmeter — dips — choice
perpendicular to the hole axis (i.e. tool axis) and al] at the
same depth. On the processed log they will be seen as
This is a simple concept but important (Cameron, 1992).
dips of apparently good quality, but will have a dip angle
It shows that the dipmeter interpretation problem is one
equal to the borehole deviation (i.e. tool tilt) and with an
of how to ‘choose’ dip data.
azimuth exactly opposite. These are historically termed
mirror image dips.
180