
Page 195 - The Geological Interpretation of Well Logs
P. 195
- THE DIPMETER -
(Figure 12.21). The actual style of the clumps depends on (Cameron et ai., 1993). Thus, if only dips in this range are
the bed form: tabular sets give regular clumps with low accepted as possible foreset indicators, set boundary
angle set boundary dips, trough sets give Jess regular effects will be minimised. Filtering the data in the outcrop
dips with higher angle set boundaries (Figure 12.21). example in this way yielded palaeocurrent directions
Each of the two bedforms gives a distinctive dip his- essentially identical to directions previously measured by
togram and azimuth rose diagram. The tabular sets give a classica] means (Bristow and Myers, 1989).
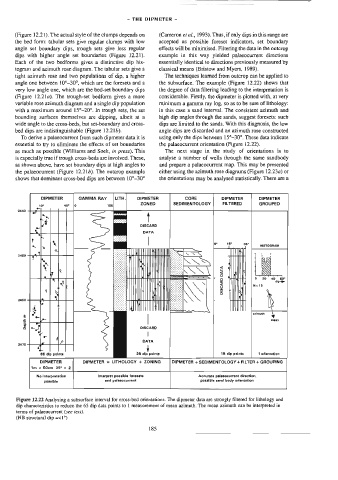
tight azimuth rose and two populations of dip, a higher The techniques learned from outcrop can be applied to
ange one between 10°-30°, which are the foresets and a the subsurface. The example (Figure 12.22) shows that
very low angle one, which are the bed-set boundary dips the degree of data filtering leading to the interpretation is
(Figure 12.21a). The trough-set bedform gives a more considerable. Firstly, the dipmeter is plotted with, at very
variable rose azimuth diagram and a single dip population minimum a gamma ray log, so as to be sure of lithology:
with a maximum around 15°—20°. In trough sets, the set in this case a sand interva). The consistent azimuth and
bounding surfaces themselves are dipping, albeit at a high dip angles through the sands, suggest foresets: such
wide angle to the cross-beds, but set-boundary and cross- dips are limited to the sands. With this diagnosis, the low
bed dips are indistinguishable (Figure 12.218). angle dips are discarded and an azimuth rose constructed
To derive a pajaeocurrent from such dipmeter data it is using only the dips between 15°-30°. These data indicate
essential to try to eliminate the effects of set boundaries the palaeocurrent orientation (Figure 12.22).
as much as possible (Williams and Soek, in press). This The next stage in the study of orientations is to
is especially true if trough cross-beds are involved. These, analyse a number of wells through the same sandbody
as shown above, have set boundary dips at high angles to and prepare a palaeocurrent map. This may be presented
the palacocurrent (Figure 12.215). The outcrop example either using the azimuth rose diagrams (Figure 12.234) or
shows that dominant cross-bed dips are between 10°-30° the orientations may be analysed statistically. There are a
DIPMETER GAMMA RAY LITH. DIPMETER CORE DIPMETER DIPMETER
40° aor lo 105 ZONED SEDIMENTOLOGY FILTERED GROUPED
a T
2440
tf || ol oS t
Ca DISCARD
-
|} a DATA
' = poetetatets |
~ |y % a 35° HISTOGRAM
a aa
2450
7" s
4]
> ; .
-
g P Y E43
3
wt
, 5
q 4
<]e Ly E I
+*R & 4iiiihy
vy)» SHIR 5 RN
* F
2460 a. ‘
N
ie \
$
c a. — azimuth ¥
& mean
S -—
a |e? DISCARD
1, on |
DIPMETER + LITHOLOGY + ZONING DIPMETER + SEDIMENTOLOGY FILTER + GROUPING
2870 a Pp DATA
2B dip points 16 dip points 1 onlentatian
4
66 dip polnta
+
DIPMETER
Im x 60cm 35° x 2
Ne interpretation
Accurate palaeocurrent direction,
Interpret possible forasets
passible sand body orientation
and palagocurrent
possible
Figure 12.22 Analysing a subsurface interval for cross-bed orientations. The dipmeter data are strongly filtered for lithology and
dip characteristics to reduce the 65 dip data points to 1 measurement of mean azimuth. The mean azimuth can be interpreted in
terms of palacocurrent (see text).
(NB structural dip =<1°)
185