Page 199 - The Geological Interpretation of Well Logs
P. 199

-  THE  DIPMETER  -


                     GAMMA   |DEPTH                        RAW  CURVES     NEUTRON
                               m
                      RAY
                                                            Resistivity  —   DENSITY
                                                                                              2  SHALE
                                                                                              |


                                                                                              TURBIDITES


                                                    ELL                                       |   1


                              “29590
                                                                                              SHALE
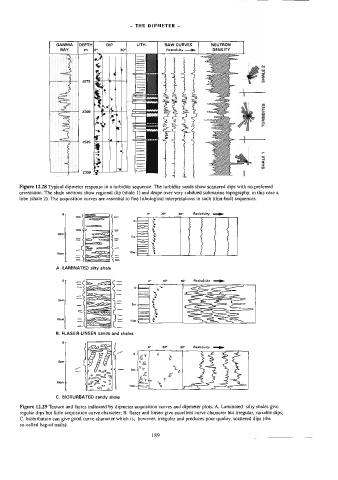
        Figure  12,28  Typical  dipmeter  response  in  @  turbidite  sequence.  The  turbidite  sands  show  scattered  dips  with  no  preferred
        orientation.  The  shale  sections  show  regional  dip  (shale  1)  and  drape  over  very  subdued  submarine  topography,  in  this  case  a
        lobe  (shale  2).  The  acquisition  curves  are  essentia)  to  fine  lithological  interpretations  in  such  (thin-bed)  sequences.


                       or    ———                     ao   20°   50°   Rasistvity  oo,
                                ==>
                                                      %
                               —=>=
                                                      y
                               Po  ll   ae   ll
                      Sem  F                          8
                                               Sm
                                  poe
                            =   =>                     .
                                   =a]     \          x
                             4
                     1oem   .    —y            10m     y
                             Wl            (Wu
                     &.  LAMINATED  sifty  shale
                                            Pad
                             Hl             We tba   0    20°   50°   Resistivity   —e


                     10¢m}

                     B.  FLASER-LINSEN  sands  and  shales

                       a
                                                     o
                                                          20°
                               [Oe    aed
                                                                     Resistivity  —e
                                                                60°
                      |         Weer 4  2           Ra   é   e
                                                  2            pP
                             \\   a   on                       ‘p
                                      =>            Ry
                                 ens  %                     &
                                                   =
                                               10m   =      “
                     toem      Lea  >  S             ’  in   3
                                 ee
                                     =
                                 ao
                                    WD

                     C.  BIOTURBATED  sandy  shale
        Figure  12.29  Texture  and  facies  indicated  by  dipmeter  acquisition  curves  and  dipmeter  plots.  A.  Laminated  silty  shales  give
        regular  dips  but  little  acquisition  curve  character;  B.  flaser  and  linsen  give  excellent  curve  character  but  irregular,  variable  dips;
        C.  bioturbation  can  give  good  curve  character  which  is,  however,  irregular  and  produces  poor  quality,  scattered  dips  (the
        so-called  bag-of-nails).
                                                      189
   194   195   196   197   198   199   200   201   202   203   204