
Page 201 - The Geological Interpretation of Well Logs
P. 201
- THE DIPMETER -
expressed as a percentage, is normally 50%, although trends in the more consistent data. However, programmes
25% sometimes gives better results. The search angle which group and do not modify the original data are prob-
may be set reasonably low if the general dip is known. ably better (see next section).
Programmes that generalise and ‘clean up’ dipmeter logs On the log itself, structural dip should be measured
can be used for structural work. Cluster, a Schlumberger over fine grained (shale) intervals where bedding is
programme (Hepp and Dumestre, 1975), attempts to more likely to be planar and regular (Figure 12.30). Thick
diminish inconsistent dips so bringing out structural shale intervals are clearly best since thinner shales in
sand-shale sequences often show distortion inherited
during compaction. Structural dip may be measured
either on the log itself when it is relatively constant and
there is little scatter, or from a stereographic polar plot,
where it will be chosen as the most common orientation
(Figure 12.14). Statistical tests may also be applied to
derive a value. In the case of structure, simple two dimen-
sional statistics are usually not acceptable and it is
necessary to apply eigen vector analysis (Davis, 1986).
A reliable identification of structural dip is essential, as
most recognisable structural features are a distortion of it.
The structural interpretation of dipmeter data, like struc-
tural geology, is about geometry and geometrical
consistency or inconsistency.
4 450
Structural dip: correlation, mapping
and seismic sections
The most straightforward use of the structural dipmeter is
in simple structural situations. For example, on structural
re cross-sections or cogrelation sections which are drawn to
show the apparent dip in the line of the section) can be
scale, dipmeter stick plots in the line of the section (i.e.
very helpful. Secondly, seismic maps can be checked
MN against the dipmeter. The contours of a typical, depth
converted (isobath) seismic map contain an implied
amount of dip and orientation. Map and dipmeter can be
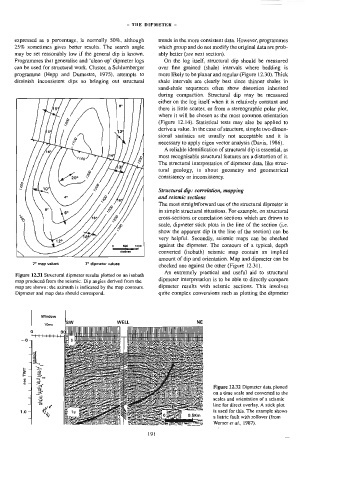
7° map values 7° dipmeter values
checked one against the other (Figure 12.31).
An extremely practical and useful aid to structural
Figure 12.31 Structural dipmeter results plotted on an isobath
dipmeter interpretation is to be able to directly compare
map produced from the seismic. Dip angles derived from the
map are showa: the azimuth is indicated by the map contours. dipmeter results with seismic sections. This involves
Dipmeter and map data should correspond. quite complex conversions such as plotting the dipmeter
Window
WELL RAAT NE
HEL es
LI EN nM | i In I TO ee ae i i
Ty 1
MUU
oH
|
Ue oes
ie eee
oe
Ts Dearne
t
ims E ea eps eat’
eae eee | erin Re
2 4 a cera Za A eh ian orale
Pitter
3 | = - pasion he nee Or fangs Hie 5 cae Rh
Aes
a
7 a ee By RG cei eae Sno Figure 123) Dipaeter data plored
vi
a 3 ¢) Cts ¢
| 2 a 2 Us SS ee scales and orientation of a seismic
4 “Y ie Mh Se oete ne 2 Sate line for direct overlay. A stick plot
10- 2 is used for this. The example shows
en on :
| “4, meal x re . : ee a) rims a listric fault with rollover (from
ee 0. em
Werner e7 a/., 1987).
19%