
Page 197 - The Geological Interpretation of Well Logs
P. 197
- THE DIPMETER -
1990). ‘Classic’ channel fill with compaction drape which
DIF PLOT GRAIN SIZE | LITH. RAW CURVES features in many dipmeter manuals is reserved for the
ia Reslotlvlty —e
very large scale and is rare (see Figure 12.27). More
! 7 7
si 4 i { )
) ( |
typical, in fact, are compaction features above or below
| | {
channels, although the orientation of these in respect to
the channel axis is generally difficult to be certain of.
rer
;
. *
j s
‘ { Some other structures
2708
.
Many features detected by the dipmeter which are shown
?
ze to have a marked preferred orientation, have no sedimen-
tological model applicable to dipmeter interpretation. For
me
example, HCS (hummocky cross-stratification) often
gives good, slightly irregular dip with vertically consis-
4 \.
zt
‘ es é
tent orientations (Figure 12.26). HCS is generally not
bm] : % 3 thought of as showing a depositional orientation: the dip-
é
et al., 1995). The dipmeter suggests that in fact it is quite
23 ¢ : \ meter suggests otherwise. Recently, it has been suggested
that in rare cases, preferred orientations may exist (Duke,
na, - .
wt , g common. However, whether this orientation is parallel to
zs 14 Aa t mat oo the coastline, facing the offshore or the onshore (most
Sos ‘ \ a
5 siractural —~ I i probable) is not yet known (cf. Williams and Soek,
*. dip (2 = Kt
melt 2 = = SN
Py | So = 0 [o! * —_ 1992).
_ c 5
The dipmeter characteristics of turbidite sequences are
nals | ' =,
generally uncertain. One example, however, shows some
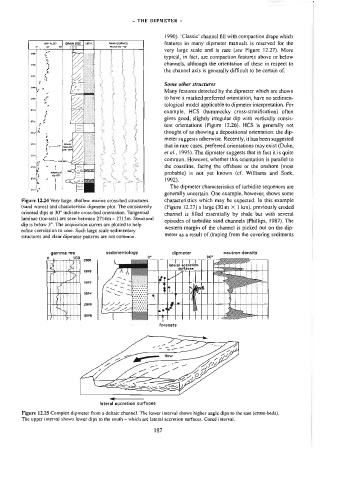
Figure 12.24 Very large, shallow marine crass-bed structures characteristics which may be expected. In this example
(sand waves) and characteristic dipmeter plot. The consistently (Figure 12.27) a large (30 m X 1 km), previously eroded
oriented dips at 30° indicate cross-bed orientation. Tangential
channei is filled essentially by shale but with several
laminae (toe-sets) are seen between 2714m — 2715m. Structural
episodes of turbidite sand channels (Phillips, 1987). The
dip is below 3°, The acquisition curves are plotted to help
westemm margin of the channel is picked out on the dip-
refine correlation to core. Such large scale sedimentary
meter as a result of draping from the covering sediments
structures and clear dipmeter patterns are not common.
gamma ray sedimentology ° dipmeter 3 neutron-density
0 4150 ° ©
_—
42S
-
2888 app ee ap Se
o | 2 lateral accretion Mp i;
surfaces
ag09 " ys a !
Re!
<? |
ie
j
i
2892
4
|
3! |
et
sore
*
zace
$
2e98
lo
f
foresets
a
_“ “_ “oo Ste, iy
~~ ,
oe — — flow J
“eo nt at — ca Lol,
7 < “— 4
Lo ZO, a
- . - = oo ape
SS ES)
oe
lateral accretion surfaces
Figure 12.25 Complex dipmeter from a deltaic channel. The lower interval shows higher angle dips to the east {cross-beds).
The upper interval shows lower dips to the south — which are lateral accretion surfaces. Cored interval.
187