
Page 198 - The Geological Interpretation of Well Logs
P. 198
~- THE GEOLOGICAL INTERPRETATION OF WELL LOGS -
gamma ray sedimentology dipmeter neutron-density
9 150
Figure 12.26 Dipmeter characteristics of HCS (hummocky cross-stratification) in a coarsening-up, marine sequence. Low angle
dips with consistent orientations occur in HCS quite frequently. Cored interval.
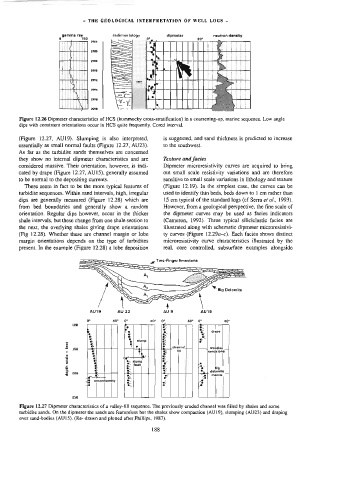
(Figure 12.27, AU19). Slumping is also interpreted, is suggested, and sand thickness is predicted to increase
essentially as small normal] faults (Figure 12.27, AU23). to the southwest.
As far as the turbidite sands themselves are concerned
they show no internal dipmeter characteristics and are Texture and facies
considered massive. Their orientation, however, is indi- Dipmeter microresistivity curves are acquired to bring
cated by drape (Figure 12.27, AU15), generally assumed out small scale resistivity variations and are therefore
to be normal to the depositing currents. sensitive to small scale variations in lithology and texture
These seem in fact to be the more typical features of (Figure 12.19). In the simplest case, the curves can be
turbidite sequences. Within sand intervals, high, irregular used to identify thin beds, beds down to | cm rather than
dips are generally measured (Figure 12.28) which are 15 cm typical of the standard logs (cf Serra er ai., 1993).
from bed boundaries and generally show a random However, from a geological perspective, the fine scale of
orientation. Regular dips however, occur in the thicker the dipmeter curves may be used as facies indicators
shale intervals, but these change from one shale section to (Cameron, 1992). Three typical siliciclastic facies are
the next, the overlying shales giving drape orientations illustrated along with schematic dipmeter microresistivi-
(Fig $2.28). Whether these are channel margin or lobe ty curves (Figure 12.29a-c). Each facies shows distinct
margin orientations depends on the type of turbidites microresistivity curve characteristics illustrated by the
present. In the example (Figure 12.28) a lobe deposition real, core controlled, subsurface examples alongside
A
o* 40’ 0° 40° 0° aor 9° ane
ts
*
<
128
i x = |
_ 4 a e drape
* x
a
L stump = o
¥
©
Bisco ehannet|_| | | moseive —|
¥
te!
LS
1 3 * = im san dsione
2 €
a .
3 , “o slump o
&
£ o> fault ¥. i? Big
s
re |
Boe _ |
#, | dotomine
=
¥
a J £ P a & a mantle
% ¥ = “ *
te | ne “ Lo
258
Figure 12.27 Dipmeter characteristics of a valley-fill sequence. The previously eroded channel was filled by shales and some
turbidite sands. On the dipmeter the sands are featureless but the shales show compaction (AU19), slumping (AU23) and draping
over sand-bodies (AU15). (Re- drawn and plotted after Phillips, 1987).
188