
Page 202 - The Geological Interpretation of Well Logs
P. 202
- THE GEOLOGICAL INTERPRETATION OF WELL LOGS ~
on a time scale rather than depth scale, correcting for it must be angular: disconformities or paraconformities
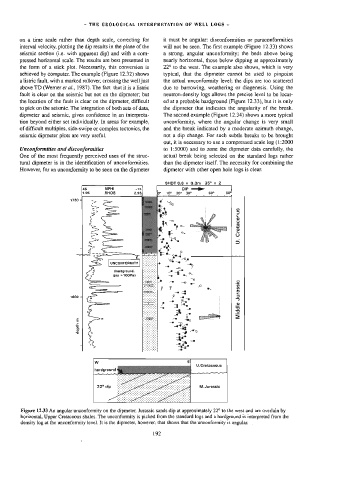
interva] velocity, plotting the dip results in the plane of the will not be seen. The first example (Figure ]2.33) shows
seismic section (i.e. with apparent dip) and with a com- a strong, angular unconformity; the beds above being
pressed horizontal scale. The results are best presented in nearly horizontal, those below dipping at approximately
the form of a stick plot. Necessarily, this conversion is 22° to the west. The example also shows, which is very
achieved by computer. The example (Figure 12.32) shows typical, that the dipmeter cannot be used to pinpoint
a listric fault, with a marked rollover, crossing the well just the actual unconformity level; the dips are too scattered
above TD (Werner et ai., 1987). The fact that it is a listric due to burrowing, weathering or diagenesis. Using the
fault is clear on the seismic but not on the dipmeter; but neutron-density logs allows the precise level to be locat-
the location of the faule is clear on the dipmeter, difficult ed at a probable hardground (Figure 12.33), but it is only
to pick on the seismic. The integration of both sets of data, the dipmeter that indicates the angularity of the break.
dipmeter and seismic, gives confidence in an interpreta- The second example (Figure 12.34) shows a more typical
tion beyond either set individually. In areas for example, unconformity, where the angular change is very small
of difficult multiples, side-swipe or complex tectonics, the and the break indicated by a moderate azimuth change,
seismic dipmeter plots are very useful. not a dip change. For such subtle breaks to be brought
out, it is necessary to use a compressed scale log (1:2000
Unconformities and disconformities to 1:5000) and to zone the dipmeter data carefully, the
One of the most frequently perceived uses of the struc- actual break being selected on the standard logs rather
tural dipmeter is in the identification of unconformities. than the dipmeter itself. The necessity for combining the
However, for an unconformity to be seen on the dipmeter dipmeter with other open hole logs is clear.
SHDT 0.6 x_0.3m_35" x 2
45 NPHI -15 DIP —i- o
1.95 RHROB 2.96 O° yo 20° 30° . s0° , 3
1760 ~ >
en
_=
= S
= ¢
S
a
a o
en £
on 2
go oO
Tre .
a >
em»
i
nen ney
a
UNCONFOANITY | |:
thardground, :
gap ~100Ma)
Rm
w
e ~~ w
o
1800 - 5 3
2
UO ug
E =
£
$
a
o
=a
WwW
U.Cretaceous
hardground
M.Jurassic
Figure 12.33 An angular unconformity on the dipmeter. Jurassic sands dip at approximately 22° to the west and are overlain by
horizontal, Upper Cretaceous shales. The unconformity is picked from the standard logs and a hardground is interpreted from the
density log at the unconformity level. It is the dipmeter, however, that shows that the unconformity is angular.
192