Page 194 - The Geological Interpretation of Well Logs
P. 194

-  THE  GEOLOGICAL  INTERPRETATION  OF  WELL  LOGS  -

         will  not  be  differentiated  from  random,  background   The  outcrop  example  (Figure  12.21)  is  from  a  deltaic
         spread,  which  is  typically  around  5°.  As  a  rule  of  thumb,   sequence  in  which  both  tabular  and  trough  cross-bedded
         the  optimum  size  of  sedimentary  structure  resolvable  by   structures  are  present  (Cameron  er  al.,  1993).  Bed-set
         the  dipmeter  (including  internal  structures),  assuming  a   thicknesses  are  generally  1  m  (3’)  or  Jess.  That  is,  one
         correct  and  appropriate  processing,  is  30  cm  to  50  m   bedform  with  a  consistent  set  of  cross-beds  is  normally
         (1ft-160ft)  (Figure  12.20).  There  are  exceptions.   less  than  |  m  in  thickness.  This  is  a  typical  size  (thick-
                                                           ness)  and  has  implications  for  the  choice  of  processing
         Cross-beds  and  palaeocurrents                   parameters  as  discussed  above.  Only  logs  with  small
         Dipmeter  response  to  cross-bedding  is  central  to  sedi-   correlation  intervals,  in  this  example  20  cm  (simulated),
         mentary  dipmeter  interpretation.  All  the  basic  principles   will  contain  foreset  data.  When  the  correlation  interval  is
         are  involved.  Response  depends  on  textural  (electrical)   too  large,  the  set  boundaries,  which  have  a  high  textural
         contrast,  size  of  structure  and  processing  parameters.   contrast  and  hence  create  a  strong  resistivity  anomaly,
         Moreover,  interpretation  of  cross-beds  requires  a  knowl-   will  dominate  the  correlations  (Figure  12.19).  A  correla-
         edge  of  the  sedimentology  of  bed-forms  and  an   tion  interval  of  no  more  than  half  the  bedform  thickness  is
         understanding  of  the  manipulation  of  grouped  dip  and   needed  to  bring  out  the  internal  structure.
         azimuth  data.  These  principles  will  be  ijlustrated  using   With  a  correct  correlation  interval,  the  outcrop  work
         dipmeter-type  logs  (dip-logs)  measured  at  outcrop  as  well   demonstrates  that  a  typical  cross-bedded  interval  shows
         as  subsurface  examples.                         dip  groupings  or  ‘clumps’  related  to  the  cross-bed  dips

                                                                                          HISTOGRAM
                     i
          Log  22   re   e-  ange  ae   d  directh  50°   a)   TABULAR   SETS        I  4         N=404
                               hdd

                                                                                  o   :
                                                                                  o  *
       6m
                                                                                  Ex
        "                                                                         2   -
              —   ow   *®

                   *   z                                       badfarm              18
       Im -                                                                          a
                         t  ,
                          %
                          a               v
                          a             «
       2m      “=   o-

                          4)

                           ‘              °                           b  gncsin
                ¥
           NI
                                                                      surtace”
                                          ®
       3m  5       *|©                    ®                          4


           NY               «                                       foresets
           N               t              Tabular  sets,  planar  foresets

       4m  JN       ?     .                                                                 AZIMUTH

                                                                                           HISTOGRAM
                     -                    b)  TROUGH  SETS                          -

                                                                                     j           N=-512
       0              ®                                                               i
        mM
           KO             “ly                                   dedtorm            .
          NS             ,                                                        2
                        re
                         t
        Im  S&S                                                                   2
           Nw              2
           RR           !   .
          RS                ;
        2m  AT  3
                          *
          Pa         ‘                                                                         N
                       @
                           °
            =
                     [+-—@    |            Trough  sets,  curved  foresets   ‘oresels          !


       4m  +——           ®   ‘               mum  measure  for  palaeocurrant
                           -
       3m  4.
              —


                                        @®  set  boundary  dips   f£  foresets              AZIMUTH
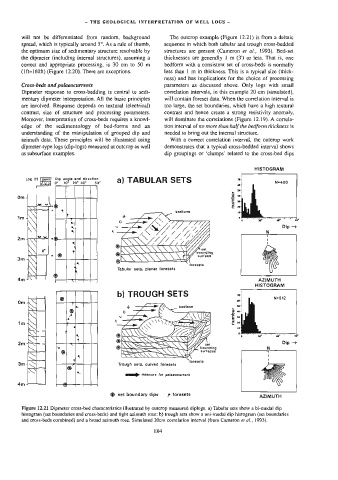
         Figure  12.21  Dipmeter  cross-bed  characteristics  illustrated  by  outcrop  measured  diplogs.  a)  Tabular  sets  show  a  bi-modal  dip
         histogram  (set  boundaries  and  cross-beds)  and  tight  azimuth  rose:  b)  trough  sets  show  a  uni-modal  dip  histogram  (set  boundaries
         and  cross-beds  combined)  and  a  broad  azimuth  rose.  Simulated  20cm  correlation  interval  {from  Cameron  et  af.,  1993).
   189   190   191   192   193   194   195   196   197   198   199