
Page 192 - The Geological Interpretation of Well Logs
P. 192
- THE GEOLOGICAL INTERPRETATION OF WELL LOGS -
and includes sedimentary structures such as laminations, correlation intervals are used that the internal features
cross-beds, bioturbations, slumps and drapes. The stand the chance of being measured (Figure ]2,!9b).
principal objective of sedimentary dipmeter interpretation Typically, the dipmeter processed for a sedimentary
is to find the orientation of reservoirs and reservoir para- interpretauion will have a correlation interval of 15 cm-
meters. This can be based on the orientation of internal 20 cm (6"-10") and a step distance of 7 cm-10 cm
features such as cross-beds and hence palaeocurrents, or (3"-5"). However, these parameters will depend on the
external features such as compaction drapes. The charac- size of the sedimentary features being looked for and the
terisation of facies is another objective (Table 12.1). For quality of the data. Interpretation begins with the choice
some unknown reason, some service companies refer to of processing parameters (see especially cross-beds and
this use of dipmeter as ‘stratigraphic’. palaeocusrents below).
Dipmeter data must be specifically processed for sedi-
mentary interpretation. The effects of changing the Scale
correlation interval in fixed interval correlation process- When the dipmeter is used as a sedimentological tool,
ing have already been illustrated (Figure 12.18). Smaller as described above, the question of scale arises immedi-
correlation intervals are necessary for sedimentary ately. What is the optimum size of sedimentary feature
studies. If the dip of the internal laminae of sedimentary ‘seen’ by the dipmeter (i.e. the dip measured) and what
structures is being looked for, then the length of the is the minimum size? The minimum resolution of the
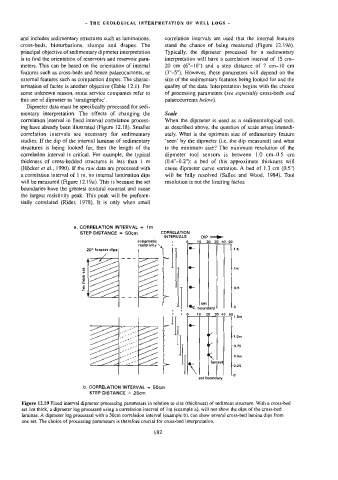
correlation interval is critical. For example, the typical dipmeter tool sensors is between 1.0 cm-0.5 cm
thickness of cross-bedded structures is less than 1 m (0.4°-0.2"): a bed of this approximate thickness will
(Hocker e? al., 1990). If the raw data are processed with cause dipmeter curve variation. A bed of 1.3 cm (0.5")
a correlation interval of 1 m, no internal lamination dips will be fully resolved (Sallee and Wood, 1984). Tool
will be measured (Figure 12.19a). This is because the set resolution is not the limiting factor.
boundaries have the greatest textural contrast and cause
the largest resistivity peak. This peak will be preferen-
tially correlated (Rider, 1978). It is only when small
a. CORRELATION INTERVAL = 1m
STEP DISTANCE = 50cm CORRELATION
INTERVALS lp <p
schematic , 9 10-20 30 40 50
resistivity \. ,
20° foreset dips ee 1.6
FID ES
(4 Fe . tn
» Zs
% =
2
* EEF CE - os
set
, Oe boundary + 0
20
30 40
10
| 19 501 em
_ | . |
AN A - 1.0m
tr O.75
. + 0.25
foreset 0.5m
-9
set boundary
b. CORRELATION INTERVAL = 50cm
STEP DISTANCE = 25cm
Figure 12.19 Fixed interval dipmeter processing parameters in relation to size (thickness) of sediment structure. With a cross-bed
set 1m thick, a dipmeter log processed using a correlation interval of 1m (example a}, will not show the dips of the cross-bed
laminae. A dipmeter log processed with a 50cm correlation interval (example b), can show several cross-bed lamina dips from
one set. The choice of processing parameters is therefore crucial for cross-bed interpretation.
{82