
Page 241 - The Geological Interpretation of Well Logs
P. 241
- FACIES, SEQUENCES AND DEPOSITIONAL ENVIRONMENTS FROM LOGS -
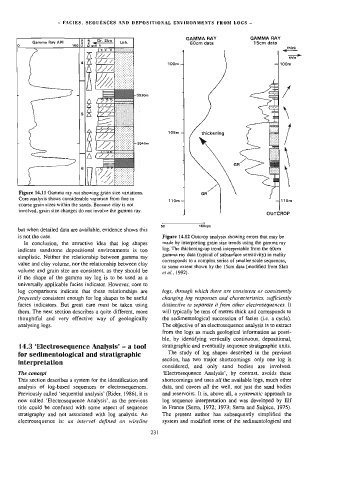
GAMMA RAY GAMMA RAY
Gamma Ray API 60cm data 15cm data
thick
thin
100m | 100m
ro
] 1
= /
3530m eae
(es)
i!
S| ‘\
105m — thickening TI
3640m
GR
Figure 14.11 Gamma ray not showing grain size variations. J
Core analysis shows considerable variation from fine to
110m 4 110m
coarse grain sizes within the sands. Because clay is not
involved, grain size changes do not involve the gamma ray. OUTCROP
50 160cps
but when detailed data are available, evidence shows this
is not the case. , Figure 14.12 Outcrop analysis showing errors that may be
In conclusion, the attractive idea that log shapes made by interpreting grain size trends using the garmma ray
log. The thickening-up trend interpretable from the 60cm
indicate sandstone depositional environments is too
gamma ray data (typical of subsurface sensitivity) in reality
simplistic. Neither the relationship between gamma ray
corresponds to a complex series of smaller scale sequences,
value and clay volume, nor the relationship between clay
to some extent shown dy the 15cm data (modified from Slatt
volume and grain size are consistent, as they should be er al., 1992).
if the shape of the gamma ray log is to be used as a
universally applicable facies indicator. However, core to
log comparisons indicate that these relationships are logs, through which there are consistent or consistently
frequently consistent enough for log shapes to be useful changing log responses and characteristics, sufficiently
facies indicators. But great care must be taken using distinctive to separate it from other electrosequences. It
them. The next section describes a quite different, more will typically be tens of metres thick and corresponds to
thoughtful and very effective way of geologically the sedimentological succession of facies (i.e. a cycle).
analysing logs. The objective of an electrosequence analysis is to extract
from the logs as much geological information as possi-
ble, by identifying vertically continuous, depositional,
14.3 ‘Electrosequence Analysis’ - a tool stratigraphic and eventually sequence stratigraphic units.
The study of log shapes described in the previous
for sedimentological and stratigraphic
section, has two major shortcomings: only one log is
interpretation
considered, and only sand bodies are involved.
The concept ‘Electrosequence Analysis’, by contrast, avoids these
This section describes a system for the identification and shortcomings and uses ai/ the available logs, much other
analysis of log-based sequences or electrosequences. data, and covers aif the well, not just the sand bodies
Previously called ‘sequential analysis’ (Rider, 1986), it is and reservoirs. Jt is, above all, a systematic approach to
now called ‘Electrosequence Analysis’, as the previous log sequence interpretation and was developed by Elf
title could be confused with some aspect of sequence in France (Serra, 1972; 1973; Serra and Sulpice, 1975).
stratigraphy and not associated with log analysis. An The present author has subsequently simplified the
electrosequence is: an interval defined on wireline system and modified some of the sedimentological and
231