
Page 243 - The Geological Interpretation of Well Logs
P. 243
- FACIES, SEQUENCES AND DEPOSITIONAL ENVIRONMENTS FROM LOGS -
cores, swe,
LEZ LBOrACIES sample
pean anes 4 analysis
facies breaks
diostrat.
successions uncs. faults
seismic
SEQUENCE
STRATIGRAPHY
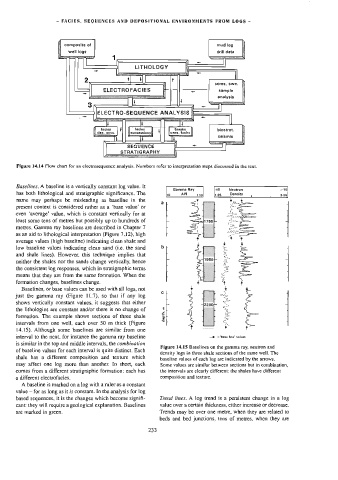
Figure 14.14 Flow chart for an electrosequence analysis. Numbers refer to interpretation steps discussed in the text.
Baselines. A baseline is a vertically constant log value. It
Gamma Ray 46 Neutron Isl
has both lithological and stratigraphic significance. The ho API 110) 1:95 _Oensity : 2-95|
Name may perhaps be misleading as baseline in the
art 4
present context is considered rather as a ‘base value’ or
even ‘average’ value, which is constant vertically for at
least some tens of metres but possibly up to hundreds of
metres. Gamma ray baselines are described in Chapter 7
as an aid to lithological interpretation (Figure 7.12), high
average values (high baseline) indicating clean shale and
low baseline values indicating clean sand (i.e. the sand b . J
and shale lines). However, this technique implies that
neither the shales nor the sands change verticaliy, hence L 1950- 4
the consistent log responses, which in stratigraphic terms
means that they are from the same formation. When the r Ve
formation changes, baselines change.
Baselines, or base values can be used with all] logs, not
c $7 .
just the gamma ray (Figure 11.7), so that if any log
shows vertically constant values, it suggests that either
2200+- 4
the lithologies are constant and/or there is no change of € | .
£
formation. The example shows sections of three shale < L
®
oo 5 4
intervals from one well, each over 50 m thick (Figure
14.15), Although some baselines are similar from one
interval to the next, for instance the gamma ray baseline —» =‘base line’ values
is similar in the top and middle intervals, the combination
Figure 14,15 Basetines on the gamma ray, neutron and
of baseline values for each interval is quite distinct. Each
density logs in three shale sections of the same well. The
shale has a different composition and texture which
baseline values of each Jog are indicated by the arrows.
may affect one log more than another. In short, each Some values are similar between sections but in combination,
comes from a different stratigraphic formation: each has the intervals are clearly different: the shales have different
a different electrofacies. composition and texture.
A baseline is marked on a log with a ruler as a constant
value — for as long as it is constant. In the analysis for log
based sequences, it is the changes which become signifi- Trend lines. A log trend is a persistent change in a log
cant: they will require a geological explanation. Baselines value over a certain thickness, either increase or decrease.
are marked in green. Trends may be over one metre, when they are related to
beds and bed junctions, tens of metres, when they are
233