Page 246 - The Geological Interpretation of Well Logs
P. 246

-  THE  GEOLOGICAL  [INTERPRETATION  OF  WELL  LOGS  -


                                                                            NEUTRON  @
                                         [RESISTIVITY  ohm-m2/m]___SONIOAM
                                      =
                                                                    (©
                                                                                           0
               o  82   GAMMARAY  API   je)   fy   10   60|106   BO   goles   DENSITY  g/om9   2.78


                                                                               wwncy
                                                                            a
               105                                                    oN   _  us  Fo,         BREAK

                                                                        ose                 CHANNEL
                                                                           “E,              EROSION
               207
                                                                       ar       density  —->=
                                                                         se
                                                                             en
              30n


                 |   GAMMA  RAY  API     RESISTIVITY  ohm-me/m   SONIC  p/tt   [64   NEUTRON @   °
                9  _9,  Cal  2   100     1.0           0/406      402.06   DENSITY  _g/em?   27


                  bit
                 siza
               04
                                                                    1                         BREAK
               204
                                                                                            FLOODING
                                                                                             SURFACE
              30m


                                    is   RESISTIVITY  ohm—-ma/m]   SONG  A/   84   NEUTRONS   T6]

                °      Gal,   3   10     0.2   4,0     40/155      aoli.8   DENSITY  g/cm?   2.46


                                      >                                    en
                                      oc
                                      =<
                                      -
               104                    a
                                      I                                                        BREAK
                                                                                              UNCON.
               204                                                                           FORMITY
              30m  3

              30.                                                                             BREAK

                                                                             NEUTRON  ©
                                                                    46
                                                           SONG  aA
                                                                                          2.4
                                                               BN  98|1.96  _ QENSITY  g/oms
                                                         140


               104

                                                                                              FAULT
                                                                                     “
                                                                                 density
               20-


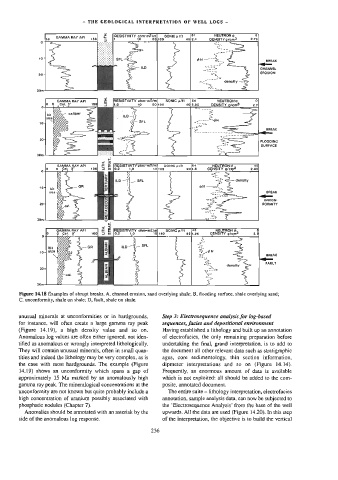
        Figure  14.18  Examples  of  abrupt  breaks.  A,  channel  erosion,  sand  overlying  shale;  B,  flooding  surface,  shale  overlying  sand;
        C,  unconformity,  shale  on  shale;  D,  fault,  shale  on  shale.
        unusual  minerals  at  unconformities  or  in  hardgrounds.   Step  3:  Electrosequence  analysis  for  log-based
        for  instance,  will  often  create  a  large  gamma  ray  peak   sequences,  facies  and  depositional  environment
        (Figure  14.19),  a  high  density  value  and  so  on.   Having  established  a  lithology  and  built  up  an  annotation
        Anomalous  log  values  are  often  either  ignored,  not  iden-   of  electrofacies,  the  only  remaining  preparation  before
        tified  as  anomalous  or  wrongly  interpreted  lithologically.   undertaking  the  final,  grand  interpretation,  is  to  add  to
        They  will  contain  unusual  minerals,  often  in  smal]  quan-   the  document  all  other  relevant  data  such  as  stratigraphic
        tities  and  indeed  the  lithotogy  may  be  very  complex,  as  is   ages,  core  sedimentology,  thin  section  information,
        the  case  with  most  hardgrounds.  The  example  (Figure   dipmeter  interpretations  and  so  on  (Figure  14.14).
        14.19)  shows  an  unconformity  which  spans  a  gap  of   Frequently,  an  enormous  amount  of  data  is  available
        approximately  15  Ma  marked  by  an  anomalously  high   which  is  not  exploited:  all  should  be  added  to  the  com-
        gamma  ray  peak.  The  mineralogical  concentrations  at  the   posite,  annotated  document.
        unconformity  are  not  known  but  quite  probably  include  a   The  entire  suite  —  lithology  interpretation,  electrofacies
        high  concentration  of  uranium  possibly  associated  with   annotation,  sample  analysis  data,  can  now  be  subjected  to
        phosphatic  nodules  (Chapter  7).                the  ‘Electrosequence  Analysis’  from  the  base  of  the  well
          Anomalies  should  be  annotated  with  an  asterisk  by  the   upwards.  All  the  data  are  used  (Figure  14.20).  In  this  step
        side  of  the  anomalous  log  response.      236   of  the  interpretation,  the  objective  is  to  build  the  vertical
   241   242   243   244   245   246   247   248   249   250   251