
Page 250 - The Geological Interpretation of Well Logs
P. 250
- THE GEOLOGICAL INTERPRETATION OF WELL LOGS -
1977). By Exxon it is defined as an wsconformity bound- present the subject from a weil log point of view, using
ed succession of genetically related facies (SB to SB real (this is very important) examples, in such a way that
Figure 15.1). Other workers use different definitions the information can be used without prejudice. This is a
(esp. Galloway, 1989a,b; see facies successions below), book about well logs, not the semantics of sequence
The bounding unconformities {and important internal straligraphy.
surfaces} are all caused by relative sea level changes. In
Key surfaces
the purest sequence stratigraphic application, (contested
A succession of sediments cannot be put into a sequence
by almost al] except Exxon) all major sea level changes
stratigraphic context without, first of all, identifying the
are eustatic (i.e. global) and therefore all the unconformi-
key surfaces (Baum and Vail, 1988) (Figure 15.1). These
ties bounding sequences (sequence boundaries) have
fail into three main categories: surfaces with erosion, sur-
absolute geologic ages (dated using correlative conformi-
faces with drowning and surfaces and intervals of slow
ty sections). This provides rules for correlation on a
deposition. Some examples of these are given below with
regional and global scale.
a description of their sequence stratigraphic significance.
High resolution sequence stratigraphy is the applica-
tion of sequence stratigraphic principles to outcrops,
1) surfaces with erosion: channel base,
cores and well logs. It is obviously the well log applica-
sequence boundary, regressive surface
tions which will be stressed in this section. However,
most published work on high resolution sequence — channel base erosion
stratigraphy to date is based on outcrops and cores (e.g. The commonest example of an erosion surface is the
Van Wagoner ef al, 1990; Posamentier ef ai., 1993), sharp base to a coarse channel deposit cutting into the
although as initially proposed by Exxon it was a method- sediments below. On the logs, this type of erosion surface
ology for the interpretation of closely spaced well logs is characterised by an abrupt, upward change from shale
with core control (Van Wagoner ef ail., 1990). or silt to sand and will be identified in the electro-
A word on the general approach presented here. sequence analysis (Figure 14.18a). That the overlying
Sequence stratigraphy as expounded by Exxon is heavily sequence is a channel deposit may be seen in the log
dependent on conceptual models and definitions of trends showing shaling-up and decrease in porosity. The
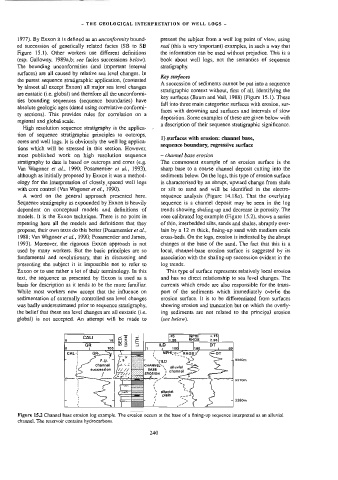
models. [t is the Exxon technique. There is no point in core calibrated log example (Figure 15.2), shows a series
repeating here all the models and definitions that they of thin, interbedded silts, sands and shales, abruptly over-
propose, their own texts do this better (Posamentier et ai., jain by a 12 m thick, fining-up sand with medium scale
1988; Van Wagoner et ai., 1990; Posamentier and James, cross-beds. On the logs, erosion is indicated by the abrupt
1993). Moreover, the rigorous Exxon approach is not changes at the base of the sand. The fact that this is a
used by many workers. But the basic principles are so local, channel-base erosion surface is suggested by its
fundamental and revolutionary, that in discussing and association with the shaling-up succession evident in the
presenting the subject it is impossible not to refer to log trends.
Exxon or to use rather a lot of their terminology. In this This type of surface represents relatively local erosion
text, the sequence as presented by Exxon is used as a and has no direct relationship to sea level changes. The
basis for description as it tends to be the more familiar. currents which erode are also responsible for the trans-
While most workers now accept that the influence on port of the sediments which immediately overlie the
sedimentation of externally controlled sea level changes erosion surface. It is to be differentiated from surfaces
was badly underestimated prior to sequence stratigraphy, showing erosion and truncation but on which the overly-
the belief that these sea level changes are al] eustatic (i.e. ing sediments are not related to the principal erosion
global) is not accepted. An attempt will be made to (see below).
<s
6 CALI 46 a 5 45 NPHI -.18
1.95
RHOB
=
2.96
GR ao!) 5 | ILD
i 100 DT
1
L100
1
86
CALS
¢ NPHIzz- <=DT
: J XN
f : channe' lcHaNNeN n> ee
hannal
s
succession BASE 5 alluvial
{
EROSION , =
— pmo Ne Sd 3370
é { 4 ? | \- alluvial = 3380
eee
plain
L
J
Figure 15.2 Channel base erosion log example. The erosion occurs at the base of a fining-up sequence interpreted as an alluvial
channel]. The reservoir contains hydrocarbons.
240