
Page 252 - The Geological Interpretation of Well Logs
P. 252
- THE GEOLOGICAL INTERPRETATION OF WELL LOGS -
7"
20"
CALI
a 5 z= ies NPAT BHOB > 25)
20 GR 1560) 2 | Sh ILD 40 140 DT 50
Tavi
2
31100 eve NPHI Spas RHOB OT~
ee ‘forced regression’ “toy 4
r
vv ft
«=
€ Gf
J ef x © 7
SFL
>
¥
prograding
\ { shoreline deposits gn 2
3130m J
~~ 6x oe== =x —~ ~~
L
C'S pegressive 2
c SURFACE OF EROSION, ~
J L distal) 2 1
S ‘ shelf “~ 2 ~~
c
3150m 4 5 “ ¢ <7
ao
ve
od
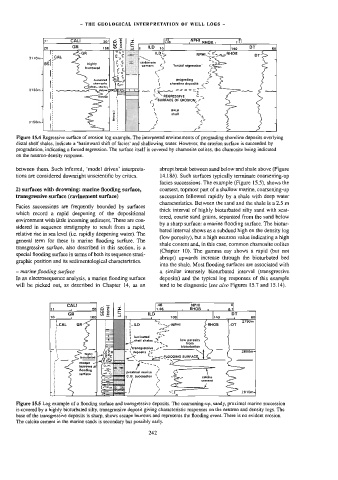
Figure 15.4 Regressive surface of erosion log exampte. The interpreted environments of prograding shoreline deposits overlying
distal shelf shales, indicate a ‘basinward shift of facies’ and shall owing water. However, the erosion surface is succeeded by
progradation, indicating a forced regression. The surface itself is covered by chamosite oolites, the chamosite being indicated
on the neutron-density response.
between them. Such inferred, ‘model driven’ interpreta- abrupt.break between sand below and shale above (Figure
tions are considered downright unscientific by critics. 14.184). Such surfaces typically terminate coarsening-up
facies successions. The example (Figure 15.5), shows the
2) surfaces with drowning: marine flooding surface, coarsest, topmost part of a shallow marine, coarsening-up
transgressive surface (ravinement surface) succession followed rapidly by a shale with deep water
characteristics. Between the sand and the shale is a 2.5 m
Facies successions are frequently bounded by surfaces
thick interval of highly bioturbated silty sand with scat-
which record a rapid deepening of the depositional
tered, coarse sand grains, separated from the sand below
environment with litle incoming sediment. These are con-
by a sharp surface: a marine flooding surface. The biotur-
sidered in sequence stratigraphy to result from a rapid,
bated interval shows as a subdued high on the density log
relative rise in sea level (i.e. rapidly deepening water). The
(low porosity), but a high neutron value indicating a high
general term for these is marine flooding surface. The
shale content and, in this case, common chamosite oolites
transgressive surface, also described in this section, is a
(Chapter 10). The gamma ray shows a rapid (but not
special flooding surface in terms of both its sequence strati-
abrupt) upwards increase through the bioturbated bed
graphic position and its sedimentological characteristics.
into the shale. Most flooding surfaces are associated with
- marine flooding surface a similar intensely bioturbated interval (transgressive
In an electrosequence analysis, a marine flooding surface deposits) and the typical log responses of this example
will be picked out, as described in Chapter 14, as an tend to be diagnostic (see aiso Figures 15.7 and 15.14),
CALI 3 : 46 NPHI a
44 1 20) o 5 z 1.96 , RHOB 2.7
GR ools ILD | | DT
10 1 109 ~ 1 1 100 140 1 60
r
7
T
: “ i i *2 ~ 2 2790m
LCAL GA i ILD >> NPHI RHOB -DT
i f ‘ <<r)
\ cx
!
: , laminated a” \ .
i half shales low porosity
: * we wee from
-i —_— € — prransgressive «#7 dloturbation _—_ —_—
rt tignly 7] {8 £9 r ‘deposits 45 2800m-
: 4 blowrbated eee st . =o FLOODING SURFAC
CS cocame 2 ES ee
t burrows at mae ~sy ™~
: flooding PT 4
: surface nae merina ¢ \
: a x
calcite
~
; i / ¢ D> cement
jos 2810m-
‘
‘N
L i
4
E
1
Figure 15.5 Log example of a flooding surface and transgressive deposits. The coarsening-up, sandy, proximal marine succession
is covered by a highly bioturbated silty, transgressive deposit givi ng characteristic responses on the neutron and density logs. The
base of the transgressive deposits is sharp, shows escape burrows and represents the flooding event. There is no evident erosion.
The calcite cement in the marine sands is secondary but possibly early.
242