
Page 255 - The Geological Interpretation of Well Logs
P. 255
- SEQUENCE STRATIGRAPHY AND STRATIGRAPHY ~
be in two parts separated by the maximum flooding and contain glauconite and pyrite and are continuous over
surface which is actually a bored, cemented starvation large areas (Ineson, 1993). On the logs, the gamma
surface or hardground (Baum and Vail, 1988). signature is evident but so also is the high neutron
The log identification of condensed sedimentation response. The lower interval shows a low density.
depends mostly on its high organic matter content In shallow environments, condensed sequences often
(Creaney and Passey, ]993) and its texture. Marine organ- follow flooding surfaces and indeed, are a continuation of
ic matter is associated with uranium (Chapter 7) so that the same deepening process (cf. Galloway, 1989a,b). Two
condensed sediments have a high gamma ray value. A examples already given (Figures 15.6, 15.7) show this
gamma ray ‘spike’ has now become the diagnostic feature clearly. Black, laminated, organic-rich shales overtie thin,
for a condensed sequence and is often considered syn- bioturbated, transgressive sand deposits. On the logs, the
onymous with the maximum flooding surface. This may high density-low neutron of the transgressive sands are
{or may not) be so. Obviously, if a gamma spike is to be followed by the high gamma ray, high neutron, low den-
caused by uranium enrichment, it should be identified on sity and high sonic (low velocity) of the organic-rich,
the spectral gamma ray as such (Figure 7.31). Regrettably condensed shales. The gradual return to normal sedimen-
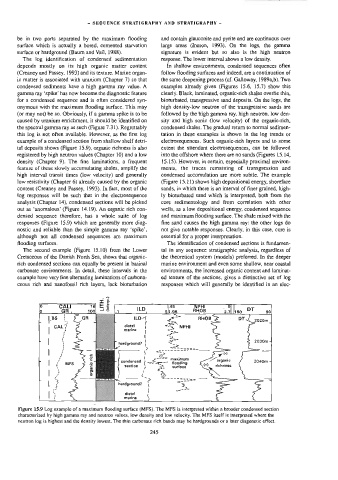
this log is not often available. However, as the first log tation in these examples is shown in the log trends or
example of a condensed section from shallow shelf detri- electrosequences. Such organic-rich layers and to some
tal deposits shows (Figure 15.9), organic richness is also extent the attendant electrosequences, can be followed
tegistered by high neutron values (Chapter 10) and a low into the offshore where there are no sands (Figures 15.14,
density (Chapter 9). The fine laminations, a frequent 15,15). However, in certain, especially proximal environ-
feature of these slowly accumulating shales, amplify the ments, the traces remaining of transgression and
high interval transit times (low velocity) and generally condensed accumulation are more subtle. The example
low resistivity (Chapter 6) already caused by the organic (Figure 15.11) shows high depositional energy, shoreface
content (Creaney and Passey, 1993). In fact, most of the sands, in which there is an interval of finer grained, high-
tog responses will be such that in the electrosequence ty bioturbated sand which is interpreted, both from the
analysis (Chapter 14), condensed sections will be picked core sedimentology and from correlation with other
out as ‘anomalous’ (Figure 14.19), An organic rich con- wells, as a low depositional energy, condensed sequence
densed sequence therefore, has a whole suite of log and maximum flooding surface. The shale mixed with the
responses (Figure 15.9) which are generally more diag- fine sand causes the high gamma ray: the other logs do
nostic and reliable than the simple gamma ray ‘spike’, not give notable responses. Clearly, in this case, core is
although not all condensed sequences are maximum essential for a proper interpretation.
flooding surfaces. The identification of condensed sections is fundamen-
The second example (Figure 15.10) from the Lower ial in any sequence stratigraphic analysis, regardless of
Cretaceous of the Danish North Sea, shows that organic- the theoretical system (models) preferred. In the deeper
rich condensed sections can equally be present in basinal marine environment and even some shallow, near coastal
carbonate environments. In detail, these intervals in the environments, the increased organic content and laminat-
example have very fine alternating laminations of carbona- ed texture of the sections, gives a distinctive set of log
ceous rich and nanofossil rich layers, lack bioturbation responses which will generally be identified in an elec-
ré
6 CALI Te) E 2 -45 NPHI ; TT,
Q if 100} += ILD, 5)1.96 RHOB 2ahso DT 90
fi [8s { ¢ GR ILD ee RHOB DT 4_2020m |
caL? NPHI
distal { <<
| 5 marine =
t \ —
; ( “>
| 4 hardground? | \ = 2
ardgroun
| / - Qo eect TSTBee —
7 8 { a maximum
- | / MFS 2 condensed {~24-— flooding
, < section ; =. surface
| i & ’ =>
2 —_ S ~ t “> > Ste
| | ‘ ad ¢ hardground? i \ eno
Soo
6
L
“=
distal
marine
|
}
Figure 15.9 Log example of a maximum flooding surface (MFS). The MFS is interpreted within a broader condensed section
characterized by high gamma ray and neutron values, low density and low velocity. The MFS itself is interpreted where the
neutron log is highest and the density lowest. The thin carbonate rich bands may be hardgrounds or a later diagenetic effect.
245