
Page 251 - The Geological Interpretation of Well Logs
P. 251
- SEQUENCE STRATIGRAPHY AND STRATIGRAPHY ~
— sequence boundary (and regressive surface of erosion} deposition. The sedimenis involved are typically deposit-
The sequence boundary is an unconformity (or correla- ed in coarsening-up, prograding shoreline successions of
tive conformity) surface on which there was subaerial the so-called forced regression (Posamentier et al., 1992).
erosional truncation and in some cases, submarine These coarsening-up deposits rest on an erosion surface
erosion (Exxon definition): it is the remaining evidence and firm ground, the regressive surface of erosion or
of a lowering of relative sea level. The vertical logic of forced regression surface, which was formed as water
facies successions, clearly, stops at such boundaries. became shallower (Plint, 1988). The log example (Figure
Recognising a sequence boundary in outcrop is not easy, 15.4) shows an abrupt upward change from a pure shale
in cores difficult, and with logs alone the difficulties are to very silty shale across a thin horizon with unusual neu-
considerable. A sequence boundary often resembles the tron-density values (the gamma ray response is not
channe] base erosion surface described previously and diagnostic), This thin bed contains reworked chamosite
in part, may be the same. On the logs, there is no set of oolites (hence the neutron-density response cf. Figure
diagnostic responses. However, there are clues. 10,22) and small phosphate pebbles, the base is sharp
The principal clue to sequence boundary identification and the bed is very widespread. It is interpreted as a
is its position in the sedimentary succession. In outcrop regressive surface of erosion (Plint, 1988). The underly-
and cores a major ‘basinward shift in facies’, caused by ing shales are distal marine shelf and above the boundary
the lowering of sea level, is diagnostic: a facies with a is the prograding, forced regression, coarsening-up shore-
depositional environment much shallower than would be line sequence. The sequence boundary is above the
expected is found resting on sediments from a deeper shoreline deposits.
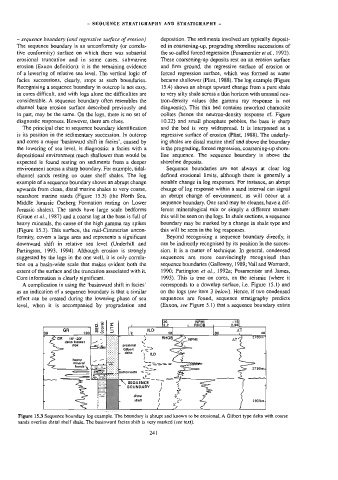
environment across a sharp boundary. For example, tidal- Sequence boundaries are not always at clear log
channel sands resting on outer shelf shales. The log defined erosional limits, although there is generally a
example of a sequence boundary shows an abrupt change notable change in-log responses. For instance, an abrupt
upwards from clean, distal marine shales to very coarse, change of log response within a sand interval can signal
nearshore marine sands (Figure 15.3) (the North Sea, an abrupt change of environment, as will occur at a
Middle Jurassic Oseberg Formation resting on Lower sequence boundary. One sand may be cleaner, have a dif-
Jurassic shales). The sands have large scale bedforms ferent mineralogical mix or simply a different texture:
(Graue et ai., 1987) and a coarse lag at the base is full of this will be seen on the logs. In shale sections, a sequence
heavy minerals, the cause of the high gamma ray spikes boundary may be marked by a change in shale type and
(Figure 15.3). This surface, the mid-Cimmerian uncon- this will be seen in the log responses.
formity, covers a large area and represents a significant Beyond recognising a sequence boundary directly, it
downward shift in relative sea level (Underhill and can be indirectly recognised by its position in the succes-
Partington, 1993, 1994). Although erosion is strongly sion. It is a matter of technique. In general, condensed
suggested by the logs in the one well, it is only correla- sequences are more convincingly recognised than
tion on a basin-wide scale that makes evident both the sequence boundaries (Galloway, 1989; Vail and Wornardt,
extent of the surface and the truncation associated with it. 1990; Partington et al., 1992a; Posamentier and James,
Core information is clearly significant. 1993). This is true on cores, on the seismic (where it
A complication in using the ‘basinward shift in facies” corresponds to a downlap surface, i.e. Figure 15.1) and
as an indication of a sequence boundary is that a similar on the logs (see item 3 below). Hence, if two condensed
effect can be created during the lowering phase of sea sequences are found, sequence stratigraphy predicts
level, when it is accompanied by progradation and (Exxon, see Figure 5.1) that a sequence boundary exists
=o]. 30 NPHI =16
a = L 2.2 {__RHOB 2.95
da _—
aT
on
120] @ 2]
80
le
ito
10
3
40
30
*
l 5 RHO AT 2760m-4
10°-20°
delta foreset Ny
proximal Sm
dips
Gilbert =<
CM
r dela } oO 4
heavy ?
mineral -= St =
s”
L ne SS 27804
oa He _—— ~~
SS SEQUENCE {
BOUNDARY
r !
L distal ¢ | 2800m
4
shelf
}
x.
Figure 15.3 Sequence boundary log example. The boundary is abrupt and known to be erosional. A Gilbert type delta with coarse
sands overlies distal shelf shale. The basinward facies shift is very marked (see text).
241