Page 254 - The Geological Interpretation of Well Logs
P. 254

-  THE  GEOLOGICAL  INTERPRETATION  OF  WELL  LOGS  -

                        CALI           -=    :           46         NPHI           o
               z
                                                        1.95
                  3]  92)                    =
                                                                                  2.7
                                                                 ,_RHOB
                         GR           aoa|   os   |   ILD                      I     DT
               10         l        139            1        19     1909)         40


                  ;                                     (         ¢  ‘-NPHI    RHOB   7
                  CSAL       GR         i        open   ‘ILD
               r   of                 i          marine           $
                  ‘                     :        C.U.
                  t   organic                   succession  7   c.u   a
               L   ?   decreases    Joi               ;     Us   ?

                  :                     '       condensed  /    {   TRANSGRESSIVE
                                                                     SURFACE
                                                               Be
                                                 section
                        organi¢-rich
                         shale
                  }                                a                {of  erosion)
                                                               J.
                  '                 =     a  fe        a  =        ss

                  ‘       eroded  bedform?   Seid  |.  bloturbated   C
                  ;                         .      anagieasies   5  =
                  ,                                japos!
                                    4            incised  vallay  fill   q.  o  °   -   ———*
                  :
               L

                  '
                  .

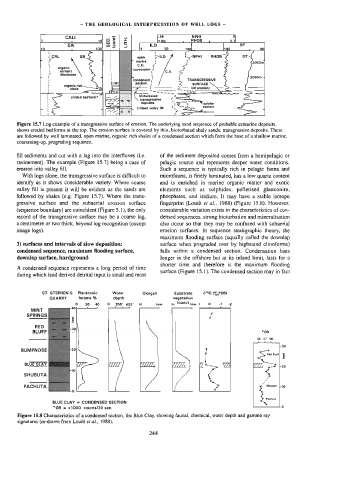
       Figure  15.7  Log  example  of  a  transgressive  surface  of  erosion,  The  underlying  sand  sequence  of  probable  estuarine  deposits,
       shows  eroded  bedforms  at  the  top.  The  erosion  surface  is  covered  by  thin,  bioturbated  shaly  sands:  transgressive  deposits.  These
       are  followed  by  wel]  laminated,  open  marine,  organic  rich  shales  of  a  condensed  section  which  form  the  base  of  a  shallow  marine,
       coarsening-up,  prograding  sequence.
       fill  sediments  and  cut  with  a  lag  into  the  interfluves  (ie.   of  the  sediment  deposited  comes  from  a  hemipelagic  or
       ravinement).  The  example  (Figure  15.7)  being  a  case  of   pelagic  source  and  represents  deeper  water  conditions.
       erosion  into  valley  fill.                      Such  a  sequence  is  typically  rich  in  pelagic  fauna  and
         With  logs  alone,  the  transgressive  surface  is  difficult  to   microfauna,  is  finely  laminated,  has  a  low  quartz  content
       identify  as  it  shows  considerable  variety.  Where  coarse   and  is  enriched  in  marine  organic  matter  and  exotic
       valley  fill  is  present  it  will  be  evident  as  the  sands  are   elements  such  as  sulphides,  pelletised  glauconite,
       followed  by  shales  (e.g.  Figure  15.7).  Where  the  trans-   phosphates,  and  iridium.  It  may  have  a  stable  isotope
       gressive  surface  and  the  subaerial  erosion  surface   fingerprint  (Loutit  er  ai,  1988)  (Figure  15.8).  However,
       (sequence  boundary)  are  coincident  (Figure  5.1),  the  only   considerable  variation  exists  in  the  characteristics  of  con-
       record  of  the  wansgressive  surface  may  be  a  coarse  lag,   densed  sequences,  strong  bioturbation  and  mineralisation
       a  centimetre  or  two  thick,  beyond  log  recognition  (except   also  occur  so  that  they  may  be  confused  with  subaerial
       image  logs).                                     erosion  surfaces.  In  sequence  stratigraphic  theory,  the
                                                         maximum  flooding  surface  (equally  called  the  downlap
       3)  surfaces  and  intervals  of  slow  deposition:   surface  when  prograded  over  by  highstand  clinoforms)
       condensed  sequence,  maximum  flooding  surface,   falls  within  a  condensed  section.  Condensation  lasts
       downlap  surface,  hardground                     longer  in  the  offshore  but  at  its  inland  limit,  lasts  for  a
                                                         shorter  time  and  therefore  is  the  maximum  flooding
       A  condensed  sequence  represents  a  long  period  of  time
                                                         surface  (Figure  15.1).  The  condensed  section  may  in  fact
       during  which  land  derived  detrital  input  is  small  and  most
                ST.  STEPHEN'S    Planktonic   Water   Oxygen   Substrate   50  (%,POB)
                  QUARRY     forams  %   depth                vegetation
                               20   40   ©   300°  600°   ft   low   ni  CON  Qe

            MINT
          SPRINGS                                                         i
             RED
             BLUFF                                                                           *GR
                  ;                                                                        86   57   5¢
                                                                                                    30
         BUMPNOSE
                                                                         ]
                                                                                               Red  Blutt|
                                                                                           ae
          BLUE  CLAY        W772      VIET      WEED         VZEZ.      Zz     ZZ         Vili,   2  bao

         SHUBUTA    -  —                                                                      $

         PACHUTA  |                                                                          “  sruues  Lag
                                                                                                    0

                                                                                              Pachuts
                    BLUE  CLAY  =  CONDENSED  SECTION
                    *GR  =  x1000  counts/30  sec.
       Figure  15.8  Characteristics  of  a  condensed  section,  the  Blue  Clay,  showing  faunal,  chemical,  water  depth  and  gamma  ray
       signatures  (re-drawn  from  Loutit  e¢  al.,  1988).
                                                      244
   249   250   251   252   253   254   255   256   257   258   259