
Page 244 - The Geological Interpretation of Well Logs
P. 244
- THE GEOLOGICAL INTERPRETATION OF WELL LOGS -
most likely to be related to cycles or sequences, or over gamma ray log and occur, with varying significance, an
hundreds of metres when they are related to large struc- all the jogs.
tures or basin filling. Trends over small] thicknesses may Trends should be marked on each log with separate
occur within longer trends as second order variations colours indicating decrease or increase upwards (e.g. red
(Figure 14.16). = increase; blue = decrease). Do not use one colour for
The trends that are chosen to be marked will vary in changes to the right or left of the log grid, this will cause
scale. Each change in log value over a few metres may be confusion during interpretation. For example an increase
considered as a trend but there is generally no geological in neutron values marked in red (indicating increase in
significance in them at this scale. Trends over greater shaliness?) deviates to the left, while an increase in gam-
thicknesses may, however, indicate persistent changes ma ray values marked in red (also indicating increase in
in sedimentation, such as coarsening-up or fining-up shaliness?) deviates to the right.
successions. It is these that should be brought out.
In most non-systematic analyses it is trends, the move- Shapes. A log shape is a recognisable, but complex jog
ment of values vertically, that catch the eye. It was, in pattern. Log shapes in sandstones have already been
effect, trends that were discussed in the previous section discussed (Section 14,2); such as increasing gamma ray
under gamma ray log shapes. Examining any log set, it in a fining-up sequence. However, shapes may occur in
is quickly very evident that trends are not limited to the any lithology, on any log, in any form and at many scales.
The form, as it exists, should be marked on the log in a
distinct colour (distinct from the baseline and trend
DEEP INDUCTION colours — say purple). It is difficult to define what is and
what is not a shape to be marked. This will possibly only
10 ohm-m2/m 190 1000
I . 4,
become evident after examining a number of logs in the
=
same area. Some shapes will simply be facies indicators,
such as the bell and funnel shapes mentioned above.
However, the target of the selection should be shapes
which are not geometrically simple, probably occur in
fine-grained intervals, could represent some distinct event
and may have basin-wide significance. Their explanation
may not be immediately evident. The example shows a
complex shape on neutron Jogs, repeated in wells 50 km
apart (Figure 14.17), which represents a set of distinctive
basin filling events covering approximately 30 Ma.
Abrupt breaks. The recognition of abrupt breaks in a log
sequence is very important. They can indicate changes in
lithology, structural breaks, changes in fluids but, most
related facies. In this sense, abrupt breaks are especially
importantly, they may indicate a break in ‘depositional
logic’, that is a break in the vertical flow of (laterally)
important in sedimentological reconstructions and
sequence stratigraphic analysis. In the analysis for elec-
trosequences, abrupt break applies to any sudden and
significant change in log values. Obviously, the -
suddenness or rate of change will vary between tools but
will normally be within the diameter of the depth of
75m
investigation of the too] concerned (Serra and Sulpice,
1975). An abrupt change on the density log (depth of
investigation 10-l5cm) will be sharper than that of the
gamma ray (depth of vertical investigation about 40 cm)
(cf. Figure 2.10,3). A rapid baseline shift may also
identify an abrupt break.
Abrupt breaks may fit logically into a lithologica] (and
depositional) pattern, such as the erosional base of a
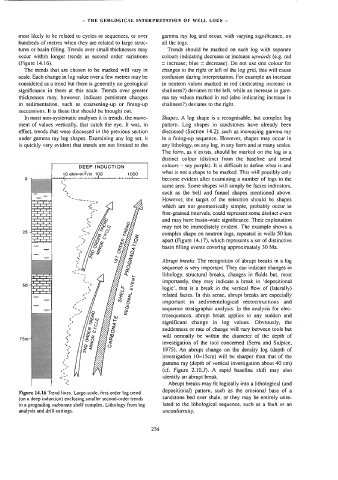
Figure 14.16 Trend lines, Large-scale, first-order log trend
sandstone bed over shale, or they may be entirely unre-
{on a deep induction) enclosing smaller second-order trends
in 2 prograding carbonate shelf complex. Lithology from log lated to the lithological sequence, such as @ fault or an
analysis and drill cuttings. unconformity.
234