
Page 275 - The Geological Interpretation of Well Logs
P. 275
- CONCLUDING REMARKS -
at present than quantitative. This will necessarily change. As tools become more sophisticated, they become more
The biological, astronomical and remote sensing sciences dependent on such software for signa] processing.
have long possessed imaging and have developed an Indeed, this has been demonstrated with the dipmeter
array of image analysis techniques. These work on the (Chapter 12}, where the raw data (the microresistivity
images themselves. They enhance, modify and extract curves) are uninterpretable until] processed into dip tad-
certain altributes. In image log analysis this is just begin- poles. The dipmeter also shows that it is necessary to be
ning. For example, extracting dip from images is familiar. familiar with at least some aspects of the signal process-
But techniques for extracting attributes indicative of thin ing in.order to make a proper interpretation of the
beds, of fractures and even grain size and permeability, software produced results. The use to which the results
are being tentatively tried (Sullivan and Schepel, 1995). will be put should influence the processing, whether this
There is no reason why more geological attributes should be for geological or petrophysical purposes. The current
not be extracted: facies, structures, sequences, and these problem for both geologist and log analyst alike is to keep
will be quantitative attributes: the software will be new. up with developments.
The second category is software which aids interpreta-
tion. While the influence of geological purpose on signal
16.5 A rainforest of software
processing software is small, the influence can be domi-
No one wants the rainforests to be cut down: but it is nant in interpretation software (should be dominant). This
happening. No one wants to throw away software: but point was made, again, with dipmeter interpretation:
they should. Software comes in many guises: indispens- dipmeter manipulation sofiware should be designed with
able, useful, infuriating, fancy, pretty, pretty useless and geological ends in mind (Chapter 12), The problem at
unnecessarily expensive. 5% for the first: 40%? for the present is that much geological software is written by
second: certainly 80% for the last. Let's look at software. software writers and undirected by geological needs.
There are essentially two categories, the first is signal There are many ‘feature rich’ packages in which the
processing software, the second is interpretation software. routines dreamed up by the software writers are very
An example of the first category is the software used to impressive, but in practical terms, useless. Many simple
produce the output from the NMR tool discussed above. routines which would be useful have not been written.
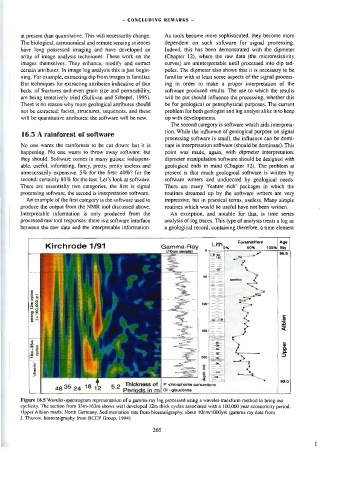
Interpretable information is only produced from the An exception, and notable for that, is time series
processed raw tool] responses: there is a software interface analysis of log traces. This type of analysis treats a log as
between the raw data and the interpretable information. Gamma-Ray
a geological record, containing therefore, a time element
Foraminifera
Age
Kirchrode 1/91
100% My
60%
ae
+
1
pirate ] (10cm sample}
ss
r
a
A
ES ieee eet es benthos wy }
cycles yr) a ee we <="
12m 100,000 cee i
.
strong a = S is
2
c |.
| 5 <
16m-35m cycles — 4 | >
a
fs
——————
‘chaotic’ —_ * | 99.0
~
<
~al
4
ia
5.2
Thickness of | P -phosphorite coneretio ns
|
4835 24 18
12
Periods in m| Gl --glauconite
Figure 16.5 Wavelet-spectrogram representation of a gamma ray log processed using a wavetei-transform method to bring out
cyclicity. The section from 35m-163m shows well developed 12m thick cycles associated with a 100,000 year eccentricity period.
Upper Albian marls, North Germany. Sedimentation rate from biostratigraphy, about 10cm/1000yrs (gamma ray data from
J. Thurow, biostratigraphy from BCCP Group. 1994).
265