Page 272 - The Geological Interpretation of Well Logs
P. 272

-  THE  GEOLOGICAL  INTERPRETATION  OF  WELL  LOGS  -


                          GR  total                                          OUTCROP
                            cps        Th  ppm     K%   40   U  ppm   14   SEDIMENTOLOGY
                                                              6
                        30      40   6   12   200
                                                                                    HIGHSTAND   SYSTEMS   TRACT
                     10  5


                                                                                         i
                                                                          a3

                                                                                    TRANSGRESSIVE   SYSTEMS   TRACT


                       wn   |
                       metres


                          OUTCROP  SPECTRAL  GAMMA  RAY

                          Q  goniatites    ®  crinoids

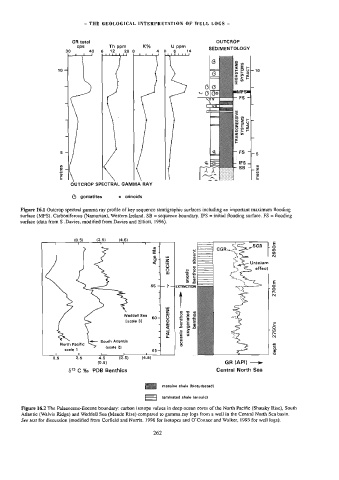
        Figure  16.1  Outcrop  spectral  gamma  ray  profile  of  key  sequence  stratigraphic  surfaces  including  an  important  maximum  flooding
        surface  (MFS).  Carboniferous  (Namurian),  Western  Ireland,  SB  =  sequence  boundary.  IFS  =  initial  flooding  surface.  FS  =  flooding
        surface  (data  from  §  .Davies,  modified  from  Davies  and  Elliott,  1996).


                           (0.5)   (2.5}   14.5)                                                 E

                     |       q      ,       q    an    ©   A            =         “S    _SGR    5
                                                      >             ¢¢            5,            ite]
                                                         a           c                          ryn9
                                                       o |)   w     3                           N
                                                       <=   Gi       a             >     Uranium
                                                         ]   8    eo  6             5      effect
                                                            i     xt                ‘
                                                                  e  5            Ss.
                                                                  ao  2               ‘          €
                                                      55  --—  ?  --7EXTINCTION                 8
                                                         4                                      re
                                                                                                N
                                            \            |g     eu
                                                         4
                                            Weddell  Sea  5  |   2  22
                                             [scale  3)    °    cce
                                                         5  4   <   oo  7D  6                    w  Qo
                                                           WwW
                                                                                                 E
                                                                ao
                      North  Pacific   —   sen  scale   1   65-  Ja  t   «33       =  :          rh  i

                                                                of
                                                                                                 A
                                                                &  °
                                       h Atlanti
                                                                3
                                                                                                 £
                                                         1
                        scale  1
                                                    1
                                            1
                                     ‘
                             l
                     4

                    0.5     2.5     4.6    (2.5)   [4.5]                                         6
                                   {0.5]                                        GR  (AP!)  —
                         83  C  %o  PDB  Benthics                            Central  North  Sea
                                                          massive  shale  (bioturbatad}
                                                    ES    laminated  shale  anoxic}
        Figure  16.2  The  Palaeocene-Eocene  boundary:  carbon  isotope  values  in  deep  ocean  cores  of  the  North  Pacific  (Skatsky  Rise),  South
         Adlaatic  (Walvis  Ridge)  and  Weddell  Sea  (Maude  Rise)  compared  to  gamma  ray  logs  from  a  well  in  the  Central  North  Sea  basin.
        See  text  for  discussion  (modified  from  Corfield  and  Norris,  1996  for  isotopes  and  O’Connor  and  Walker,  1993  for  well  Jogs).
                                                       262
   267   268   269   270   271   272   273   274   275   276   277