Page 267 - The Geological Interpretation of Well Logs
P. 267

-  SEQUENCE  STRATIGRAPHY  AND  STRATIGRAPHY  -


                    N                    2yya-11           211-701                            21714-8   [s]

                                                                               -
                        217 1-Set                                           214 18-10      aR   N   SONIC   ”
                    a                   GR   SONIC
                                                                                          o
                                                                                             100  F140
      AGES |  FORMATIONS  |r|  GR  my  SONIC   0  100%s40  40   SRY  SONIC   @R  yy  SONIC      40  5
                    Slo   108140   40                   ry   100  2140  —   o   1008140   40   .
                                                I
                                       :
                                                                                                   x  |  >


                    4                                                                                 4

                                                         =:
      a     Herring  Fm.   [3  |                          a                                          fa |
                                                                                  CATUM
                                                        L
                                                                                                  |
                                                                a
                                                                                              bar!

                                                                                 i
                                       =
      ;  z


                              vs
                          a
                    TI
                                                             sf
                                                                          $e?
       ae  2                           q   iS                                                  ¢         =


            Plenus  Marl  Fm  [ies   &   x   42   x

                                                                                }
                                                                              <
                                                                          4

                          _
      -H—-—-|      Ja]                     o             -   zl!                           \   <  I   2   2
        4           4                                                     v
                                        ile
                                              /
                                                                             fas
                                                                                               é
                                                                              S
                                        X  Fy  j
        &           3                                                                          z      1
                          3
                                                                                               3  }
      z  =)   Hidra  Fm.                       2                                                      a


                                                                                               3
      2             2  i   3   }                 tolerotaunal  zones                                  sony
      =>
                          =

      o  =          1   \    j     fog  correlation  lines
         oD                           ——   ——_—_—_—____——-  auc   HAN  HORST   —!_———_
         32
            Rédby  Fin.
      LE .
                        \Y
                           ;  F  Zz
      <3
      z¢
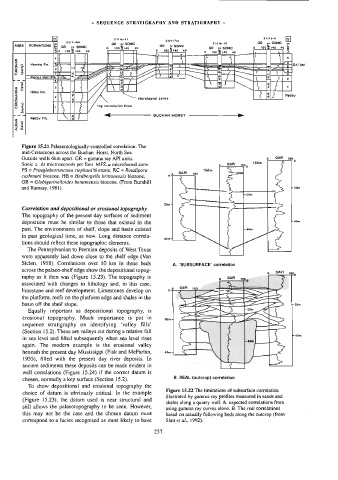
         Figure  15.21  Palaeontologically-controlled  correlation.  The
         mid-Cretaceous  across  the  Buchan  Horst,  North  Sea.
         Outside  wells  6km  apart.  GR  =  gamma  ray  API  units.                              160
                                                                                                  GAPI
         Sonic  =  At  microseconds  per  foot.  MFZ  =  microfaunal  zone.      GAPI__   180,   160m

         PS  =  Praegiobotruncana  stephani  biozone.  RC  =  Rotalipora   GaP   160m   >
               one                     .    .   *                     0
         cushmani  biozone.  HB  =  Hedbergella  brittonensis  biozone.   oF     :
         GB  =  Globigerinelloides  benionensis  biozone.  (From  Burnhill
         and  Ramsay,  1981).                                      —                                   fF  20m

                                                                                       20m
                                                                    sp

                                                           20m  4   —              s
         Correlation  and  depositional  or  erosional  topography
         The  topography  of  the  present  day  surfaces  of  sediment
         deposition  must  be  similar  to  those  that  existed  in  the                              -  40m

         past.  The  environments  of  shelf,  slope  and  basin  existed               40m    _
         in  past  geological  time,  as  now.  Long  distance  correla-
                                                                                    Lo
                                                                   PN
         tions  should  reflect  these  topographic  elements.   “om
                                                                                      |
           The  Pennsylvanian  to  Permian  deposits  of  West  Texas         Me
         were  apparently  laid  down  close  to  the  shelf  edge  (Van
         Siclen,  1958).  Correlations  over  10  km  in  these  beds
                                                              A.  ‘SUBSURFACE’  corretation
         across  the  palaeo-shelf  edge  show  the  depositional  topog-
         raphy  as  it  then  was  (Figure  15.23).  The  topography  is
         associated  with  changes  in  lithology  and,  in  this  case,
         limestone  and  reef  development.  Limestones  develop  on
         the  platform,  reefs  on  the  platform  edge  and  shales  in  the
         basin  off  the  shelf  slope.
           Equally  important  as  depositional  topography,  is
         erosional  topography.  Much  importance  is  put  in
         sequence  stratigraphy  on  identifying  ‘valley  fills’
         (Section  15.2).  These  are  valleys  cut  during a  relative  fall
         in  sea  level  and  filled  subsequently  when  sea  level  rises
         again.  The  modern  example  is  the  erosional  valley
         beneath  the  present  day  Mississippi  (Fisk  and  McFarlan,
         1955),  filled  with  the  present  day  river  deposits.  In
         ancient  sediments  these  deposits  can  be  made  evident  in
         well  correlations  (Figure  15.24)  if  the  correct  datum  is
                                                              B.  REAL  {outcrop}  correlation
         chosen,  normally  a  key  surface  (Section  15.2).
           To  show  depositional  and  erosional  topography  the
                                                           Figure  15.22  The  iimitations  of  subsurface  correlation
         choice  of  datum  is  obviously  critical.  In  the  example
                                                           itlustrated  by  gamma  ray  profiles  measured  in  sands  and
         (Figure  15.23),  the  datum  used  is  near  structural  and
                                                           shales  along  a  quarry  wail.  A.  expected  correlations  from
         still  allows  the  palaeotopography  to  be  seen.  However,
                                                           using  gamma  ray  curves  alone.  B.  The  real  correlations
         this  may  not  be  the  case  and  the  chosen  datum  must   based  on  actually  following  beds  along  the  outcrop  (from
         correspond  to  a  facies  recognised  as  most  likely  to  have   Slatt  ef  al.,  1992).   .
                                                       257
   262   263   264   265   266   267   268   269   270   271   272