Page 269 - The Geological Interpretation of Well Logs
P. 269

-  SEQUENCE  STRATIGRAPHY  AND  STRATIGRAPHY  -


            A.  SAND-BAR
                                                                                    Path  diagram
                        aR   GR                           Well  a   Well  b
                                                                              b,  6,  b,b,     ,
          so   4

                                                            a,      b,   |*-b,   a,


                                                            a,
          40-5                      SN   GR                        b,       3,
                                                                   Pby]a,-%
                                                            a,
                                                                                     :
            4   GR
                                                                    6,
                                                            8,
          30-7  —-      MaRINE‘SHALES                                       a,
         3   4                                                                          S
                                                                                          ~   ~
        g  24
                                                            a,     |        a
         E   4

         2                                                    Pl b,                               N   .
         €  105
        =                                                          —                                 “N
        &  =
            1
          —                                —  DATUM
                        GR    all       GA
                                                                              —»  gapina   }  gap  in b
            4    GR
          30-]  ——   “a                                                       N  match  (angle  change  with
                                                                                       relative  thickness}
          20-4
         vw                                               Figure  15.25  Computer  correlation.  Schematic  illustration  of
         g                                                the  sequence  matching  technique  {re-drawn  from  Fang  et  al.,
         2  +04                                           1992).
         3   4
         2
         =  o4——_.                         ——  DATUM
         2
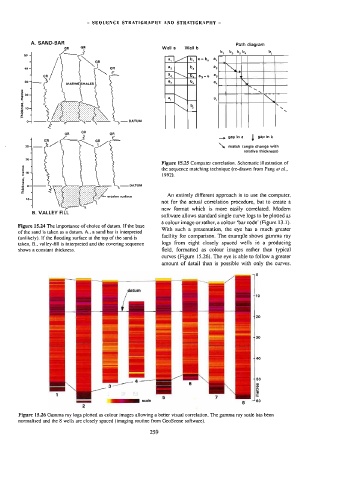
            ae                                              An  entirely  different  approach  is  to  use  the  computer,
          104                          erosion  surface   not  for  the  actual  correlauion  procedure,  but  to  create  a
            B,  VALLEY  FILL                              new  format  which  is  more  easily  correlated.  Modern
                                                          software  allows  standard  single  curve  logs  to  be  plotted  as
                                                          a  colour  image  or  rather,  a  colour  “bar  code’  (Figure  13.1).
       Figure  15.24  The  importance  of  choice  of  datum.  If  the  base
                                                          With  such  a  presentation,  the  eye  has  a  much  greater
       of  the  sand  is  taken  as  a  datum,  A..  a  sand  bar  is  interpreted
                                                          facility  for  comparison.  The  example  shows  gamma  ray
       (unlikely).  1f  the  flooding  surface  at  the  top  of  the  sand  is
       taken,  B.,  valley-fill  is  interpreted  and  the  covering  sequence   logs  from  eight  closely  spaced  wells  in  a  producing
       shows  a  constant  thickness.                     field,  formatted  as  colour  images  rather  than  typical
                                                          curves  (Figure  [5.26).  The  eye  is  able  to  follow  a  greater
                                                          amount  of  detail  than  is  possible  with  only  the  curves.
                                                                                          “90
                                                                                           10
                                                                                           20


                                                                                           30


                                                                                             50  metres


                                                                                           60

        Figure  15.26  Gamma  ray  logs  plotted  as  colowr  images  allowing  a  better  visual  correlation.  The  gamma  ray  scale  has  been
        normalised  and  the  8  wells  are  closely  spaced  (imaging  routine  from  GeoScene  software).
   264   265   266   267   268   269   270   271   272   273   274