
Page 273 - The Geological Interpretation of Well Logs
P. 273
- CONCLUDING REMARKS -
Wel] logs measured in deep water shales over the same measurements do not produce a directly interpretable log,
late Palaeocene to Early Eocene interval in the North Sea but the pulse-echo spectrum of relaxation times can be
show some remarkable changes in the uranium content successfully modelled and analysed to give a number of
measured by the spectral gamma ray logs (NGT) (Figure key petrophysical parameters. At present these include
16.2). Benthic fauna and bioturbation are abundant in the the total liquid filled porosity (from the magnitude of the
lower shale formation (Palaeocene) which has essentially ’ NMR response), the pore size distribution (from the
no uranium indicated on the NGT. The overlying shales relaxation spectrum shape), the moveable fluids or FFI
(Eocene?) have no benthos and no bioturbation (anoxic), (free fluid index) (from cut-offs applied to the relaxation
are well Jaminated and contain significant uranium. Their spectrum) and the permeability (from the FFI and pore
base is abrupt and marked by a distinct gamma ray and distribution data).
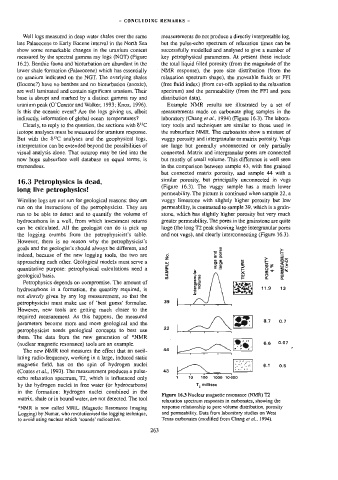
uranium peak (O’Connor and Walker, 1993; Knox, 1996). Example NMR results are illustrated by a set of
Is this the oceanic event? Are the logs giving us, albeit measurements made on carbonate plug samples in the
indirectly, information of global ocean temperatures? laboratory (Chang ef ai., 1994) (Figure 16.3). The labora-
Clearly, to reply to the question, the sections with §?C tory tools and techniques are similar to those used in
isotope analyses must be measured for uranium response. the subsurface NMR. The carbonates show a mixture of
But with the °C analyses and the geophysical logs, vuggy porosity and intergranular or matrix porosity. Vugs
interpretation can be extended beyond the possibilities of are large but generally unconnected or only partially
visual analysis alone. That outcrop may be tied into the connected. Matrix and intergranular pores are connected
now huge subsurface wel] database on equal terms, is but mostly of small volume. This difference is well seen
tremendous. in the comparison between sample 43, with fine grained
but connected matrix porosity, and sample 44 with a
similar porosity, but principally unconnected in vugs
16.3 Petrophysics is dead,
{Figure 16.3). The vuggy sample has a much lower
long live petrophysics!
permeability. The picture is continued when sample 22, a
Wireline logs are not run for geological reasons: they are vuggy limestone with slightly higher porosity but low
run on the instructions of the petrophysicist. They are permeability, is contrasted to sample 39, which is a grain-
run to be abie to detect and to quantify the volume of stone, which has slightly higher porosity but very much
hydrocarbons in a well, from which investment returns greater permeability. The pores in the grainstone are quite
can be calculated. All the geologist can do is pick up large (the long T2 peak showing large intergranular pores
the logging crumbs from the petrophysicist’s table. and not vugs), and clearly interconnecting (Figure 16.3).
However, there is no reason why the petrophysicist’s
goals and the geologist’s should always be different, and Qn
2 Ee
indeed, because of the new logging tools, the two are g ao =
z > aa
approaching each other. Geological models must serve a w & & rd E 2a
—
g wt
quantitative purpose: petrophysical calculations need a = 5 2a > ORF Ex
7 =
E
Oe
= 5 4 ee F&F
geological] basis. <q 3 w oO wi
“ sé = a oa
Petrophysics depends on compromise. The amount of sD
eS thes 11.9 13
368 Ser,
53S
hydrocarbons in a formation, the quantity required, is = pee, «
not directly given by any log measurement, so that the
petrophysicist must make use of ‘best guess’ formulae. 39
However, new tools are getting much closer to the
required measurement. As this happens, the measured
Ss 8.7 07
parameters become more and more geological and the
22
—
petrophysicist needs geological concepts to best use
them. The data from the new generation of “NMR
(nuclear magnetic resonance) tools are an example. > Be 6.6 0.07
44 “6 |
The new NMR tooi measures the effect that an oscil-
lating radio-frequency, working in a large, induced static
magnetic field, has on the spin of hydrogen nuclei fe 6.7 0.5
Pe ’
(Coates er al., 1993). The measurement produces a pulse-
echo relaxation spectrum, T2, which is influenced only 1 10 100 1000 10000
by the hydrogen nuclei in free water (or hydrocarbons) T, millisac
in the formation: hydrogen nuclei combined in the
Figure 16.3 Nuclear magnetic resonance (NMR) T2
matrix, shale og in bound water, are not detected. The tool
relaxation spectrum responses in carbonates, showing the
*NMR is now called MRIL (Magnetic Resonance Imaging response relationship to pore volume distribution, porosity
Logging) by Numar, who revotutionised the logging technique, and permeability. Data from laboratory studies on West
to avoid using nuclear which ‘sounds’ radioactive. Texas carbonates (modified from Chang er al., 1994).
263