
Page 268 - The Geological Interpretation of Well Logs
P. 268
- THE GEOLOGICAL INTERPRETATION OF WELL LOGS -
been horizontal at the time of deposition. Coals, for in thickness and changes in facies. Correlation techniques
example are originally flat, so generally are transgressive used in dipmeter processing (Chapter 12), are based on
surfaces: condensed sequences and flooding surfaces may the expectation of finding an exactly similar match, and
not be. The ultimate choice is probably a matter of trial are therefore unsatisfactory for stratigraphic correlation.
and error (see also Section 15.2). A more rewarding approach is found in sequence
matching, in which a well is divided into a number of
Correlation and seismic
units manually or by computer, and the well to be corte-
Why is there a need to say that the seismic should be used
lated is checked to see if such a unit is present and
in well correlations whenever possible? Even now, even
its degree of matching (Fang ef a/., 1992). With such a
with al] the seismic available, it must still be said: seismic
method the similarities of a number of logs or attributes
should be used in well correlation. The geophysicist
may be checked, absence is a possibility and thickness
cannot do his work without using the logs to ‘tie’ the
similarity becomes only one of the attributes, not the
picked horizons. The same is not true for the geologist.
dominant one (Figure 15.25). Thus, values can be given
He will not automatically be asked about the seismic
to acorrelation which then becomes objective (within the
control for his correlation: he should be. In fact, log
limits of the method or the software).
correlation and seismic mapping should be undertaken
Conceptually, a method in which computer decisions
together; the approach must be iterative. Examining the
can be evaluated is more attractive than a computer
mapped seismic horizons before completing a correlation
correlation which is ‘take it or leave it’. This chapter
will indicate whether such a correlation is compatible
describes how thoughtful correlation must be in terms of,
with the mapping or not. The example illustrated previ-
for instance, sequence stratigraphy, interactive log
ously (Figure 13.15) is excellent and speaks for itself.
Tesponse exploration and biostratigraphy. Without being
Computer aided correlation able to include such ideas, computer correlation will be,
Considerable effort over the years has been devoted to as is the case at present, disregarded. However, if a pro-
finding a method to allow logs to be cortelated auto- grarmme allows the similarities of two intervals to be
matically by computer (see Doveton, 1994 for review). compared, interest will be re kindled. If, moreover, this
The results have generally not produced helpful tools. facility can be applied on the screen while a correlation
Correlation inevitably involves gaps and breaks, changes panel is being prepared, it will be very useful.
SW PLACIO MONNELL NE
4 3 3 3 4 '
a-8 2 e > @ e ee? e@ e e@ oun
@ sunray @ PENTEX STO OF TEx DAMS
HAROY KRIBBS DAVIS LIPSCOMB ET AL BARNSDALL
WAEN WREN DATUM
Logs allgned on
LEONARD
iop of Valera
afe =| Qe - - eee e ween e pe ee cafes cfpdyane nee at tenes \e-bfecne D- Tieng . ee wade Jan Hs]: : - 500-4
I }
Coleman Jnt.
Lu, |(-.-c.ss00 cece epee Tee j . p 2 + 1000 4 tee
PERMIAN fondoform _ DEPTH
WOLECAMP 1800
—
thinnn- oe errr 4 eer eb peewee ale [fee ceed bee ab pee. - sy TIT F531) 20004
PENNSYLVANIAN]
CIS
=>26007
|
—47
a ONe cane nee e eee
Borne es
iS seeresr
CANYON
vertical scale exaggeraiad 4 times horizontal
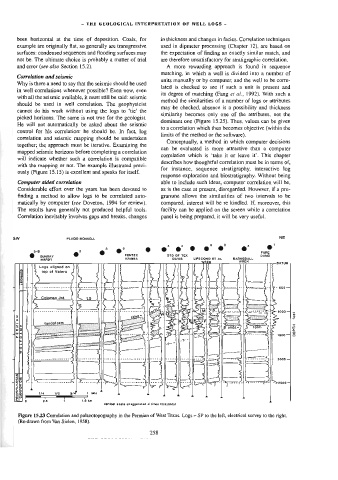
Figure £5.23 Correlation and palaeotopography in the Permian of West Texas. Logs — SP to the left, electrical survey to the right.
(Re-drawn from Van Siclen, 1958).
258