
Page 263 - The Geological Interpretation of Well Logs
P. 263
- SEQUENCE STRATIGRAPHY AND STRATIGRAPHY -
NPHI RHOB
> / il 2
coal| 2 —==2———
coals -
3
|
7 p=
" uk} * he << sand
5 m5 "aya. Pd ~" , population | i
coal] - ‘on FS2
QD 4 ut . 4 wal o. . .
2 pee |
o ‘ é .
e _ *. : : ae Sy
“poe
a io 8 . ey OP itn, eS - coal) | ——__ -- - = -FS1
cy
| silts ee ee FS
sandy shales , f° = = 1 | e
shale population condensed |b “S. = MFS
sequences
|
;
‘ to a6
Neutron % —»
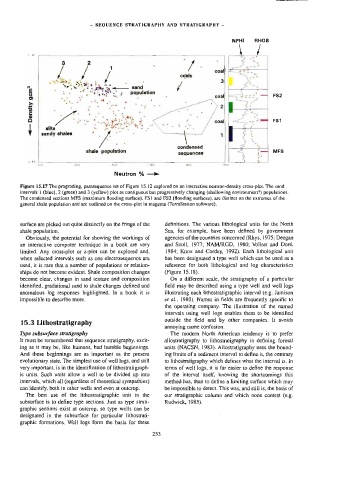
Figure 15.17 The prograding, parasequence set of Figure 15.12 explored on an interactive neutron-density cross-plot. The sand
intervals 1 (blue), 2 green} and 3 (yellow) plot as contiguous but progressively changing (shallowing environment?) populations.
The condensed sections MFS (maximum flooding surface), FS1 and FS2 (flooding surfaces}, are distinct on the extremes of the
general shale population and are outlined on the cross-plot in magenta (TerraStation software),
surface are picked out quite distinctly on the fringe of the definitions. The various lithological units for the North
shale population. Sea, for example, have been defined by government
Obviously, the potential for showing the workings of agencies of the countries concerned (Rhys, 1975; Deegan
an interactive computer technique in a book are very and Scull, 1977; NAM/RGD, 1980; Vollset and Doré,
limited. Any cross-plot or z-plot can be explored and, 1984; Knox and Cordey, 1992). Each lithological unit
when selected intervals such as one electrosequence are has been designated a type well which can be used as a
used, it is rare that a number of populations or relation- reference for both lithological and log characteristics
ships do not become evident. Shale composition changes (Figure 15,18).
become clear, changes in sand texture and composition On a different scale, the stratigraphy of a particular
identified, gradationa] sand to shale changes defined and field may be described using a type well and well logs
anomatous log responses highlighted. In a book it is illustrating each lichostratigraphic interval (e.g. Jamison
impossible to describe more. et al., 1980). Names in fields are frequently specific to
the operating company. The illustration of the named
intervals using well logs enables them to be identified
outside the field and by other companies. It avoids
15.3 Lithostratigraphy
annoying name confusion.
Type subsurface stratigraphy The modem North American tendency is to prefer
It must be remembered that sequence stratigraphy, excit- allostratigraphy to lithostratigraphy in defining formal
ing as it may be, like humans, had humble beginnings. units (NACSN, 1983). Allostratigraphy uses the bound-
And these beginnings are as important as the present ing limits of a sediment interval to define it, the contrary
evolutionary state. The simplest use of well logs, and stil! to Jithostratigraphy which defines what the interval is. In
very important, ts in the identification of lithostratigraph- ierms of well logs, it is far easier to define the response
ic units. Such units allow a well to be divided up into of the interval itself, knowing the shortcomings this
intervals, which all (regardless of theoretical sympathies) method has, than to define a limiting surface which may
can identify, both in other wells and even at outcrop. be impossible to detect. This was, and still is, the basis of
The best use of the lithosiratigraphic unit in the our stratigraphic column and which none contest (e.g.
subsurface is to define type sections. Just as type strati- Rudwick, 1985).
graphic sections exist at outcrop, so type wells can be
designated in the subsurface for particular lithostrat-
graphic formations. Well logs form the basis for these
253