
Page 114 - The Green Building Bottom Line The Real Cost of Sustainable Building
P. 114
GREEN FROM THE INSIDE OUT 93
may wish to take a representative sample rather than creating an extensive spreadsheet
charting each employee. For accuracy, Melaver, Inc. records every employee’s exact
commute distance and each vehicle’s fuel efficiency. This was done through a simple
e-mail survey where employees listed the pertinent information, which was recorded
and is updated annually.
Once this data is collected, it is placed into a spreadsheet (provided by Climate
Leaders for Melaver, Inc.) that has various emissions factors associated with each fuel
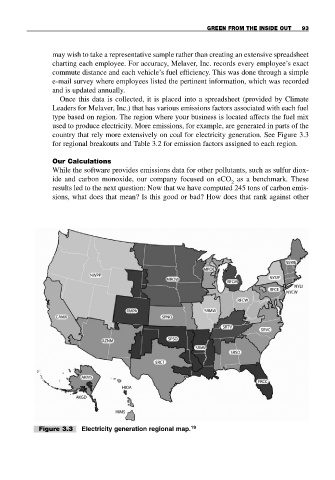
type based on region. The region where your business is located affects the fuel mix
used to produce electricity. More emissions, for example, are generated in parts of the
country that rely more extensively on coal for electricity generation. See Figure 3.3
for regional breakouts and Table 3.2 for emission factors assigned to each region.
Our Calculations
While the software provides emissions data for other pollutants, such as sulfur diox-
ide and carbon monoxide, our company focused on eCO as a benchmark. These
2
results led to the next question: Now that we have computed 245 tons of carbon emis-
sions, what does that mean? Is this good or bad? How does that rank against other
Figure 3.3 Electricity generation regional map. 19