Page 115 - The Green Building Bottom Line The Real Cost of Sustainable Building
P. 115

94  CHAPTER 3


                     firms? These questions do not have clear-cut answers (there is, for example, no require-
                     ment saying real estate firms with under thirty people should emit 300 tons or less of
                     eCO ). But knowing your eCO is a start, a baseline. The result of our company’s
                         2                      2
                     emissions audit was aggregated into Table 3.3.


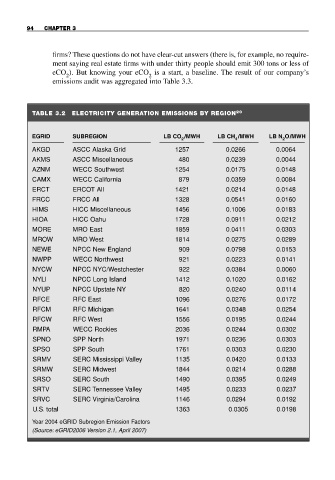
               TABLE 3.2  ELECTRICITY GENERATION EMISSIONS BY REGION    20


               EGRID      SUBREGION                 LB CO /MWH     LB CH /MWH     LB N O/MWH
                                                         2              4            2
               AKGD       ASCC Alaska Grid             1257           0.0266        0.0064
               AKMS       ASCC Miscellaneous            480           0.0239        0.0044
               AZNM       WECC Southwest               1254           0.0175        0.0148
               CAMX       WECC California               879           0.0359        0.0084
               ERCT       ERCOT All                    1421           0.0214        0.0148
               FRCC       FRCC All                     1328           0.0541        0.0160
               HIMS       HICC Miscellaneous           1456           0.1006        0.0183
               HIOA       HICC Oahu                    1728           0.0911        0.0212
               MORE       MRO East                     1859           0.0411        0.0303
               MROW       MRO West                     1814           0.0275        0.0289
               NEWE        NPCC New England             909           0.0798        0.0153
               NWPP        WECC Northwest               921           0.0223        0.0141
               NYCW        NPCC NYC/Westchester         922           0.0384        0.0060
               NYLI        NPCC Long Island            1412           0.1020        0.0162
               NYUP        NPCC Upstate NY              820           0.0240        0.0114
               RFCE        RFC East                    1096           0.0276        0.0172
               RFCM        RFC Michigan                1641           0.0348        0.0254
               RFCW        RFC West                    1556           0.0195        0.0244
               RMPA        WECC Rockies                2036           0.0244        0.0302
               SPNO        SPP North                   1971           0.0236        0.0303
               SPSO        SPP South                   1761           0.0303        0.0230
               SRMV        SERC Mississippi Valley     1135           0.0420        0.0133
               SRMW        SERC Midwest                1844           0.0214        0.0288
               SRSO        SERC South                  1490           0.0395        0.0249
               SRTV        SERC Tennessee Valley       1495           0.0233        0.0237
               SRVC        SERC Virginia/Carolina      1146           0.0294        0.0192
               U.S. total                              1363           0.0305        0.0198
               Year 2004 eGRID Subregion Emission Factors
               (Source: eGRID2006 Version 2.1, April 2007)
   110   111   112   113   114   115   116   117   118   119   120