
Page 116 - The Green Building Bottom Line The Real Cost of Sustainable Building
P. 116
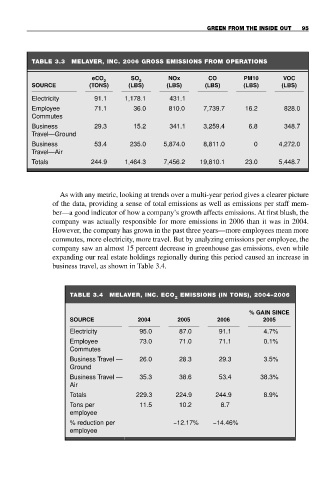
GREEN FROM THE INSIDE OUT  95


                 TABLE 3.3  MELAVER, INC. 2006 GROSS EMISSIONS FROM OPERATIONS

                                  eCO        SO        NOx        CO        PM10       VOC
                                     2         2
                 SOURCE          (TONS)     (LBS)      (LBS)     (LBS)      (LBS)      (LBS)
                 Electricity      91.1     1,178.1     431.1
                 Employee         71.1       36.0      810.0     7,739.7     16.2       828.0
                 Commutes
                 Business         29.3       15.2      341.1     3,259.4      6.8       348.7
                 Travel—Ground
                 Business         53.4      235.0     5,874.0    8,811.0       0      4,272.0
                 Travel—Air
                 Totals          244.9     1,464.3    7,456.2   19,810.1     23.0     5,448.7


                         As with any metric, looking at trends over a multi-year period gives a clearer picture
                       of the data, providing a sense of total emissions as well as emissions per staff mem-
                       ber—a good indicator of how a company’s growth affects emissions. At first blush, the
                       company was actually responsible for more emissions in 2006 than it was in 2004.
                       However, the company has grown in the past three years—more employees mean more
                       commutes, more electricity, more travel. But by analyzing emissions per employee, the
                       company saw an almost 15 percent decrease in greenhouse gas emissions, even while
                       expanding our real estate holdings regionally during this period caused an increase in
                       business travel, as shown in Table 3.4.


                           TABLE 3.4   MELAVER, INC. ECO   EMISSIONS (IN TONS), 2004–2006
                                                         2
                                                                              % GAIN SINCE
                           SOURCE              2004       2005       2006         2005
                           Electricity         95.0       87.0       91.1         4.7%
                           Employee            73.0       71.0       71.1         0.1%
                           Commutes
                           Business Travel —   26.0       28.3       29.3         3.5%
                           Ground
                           Business Travel —   35.3       38.6       53.4        38.3%
                           Air
                           Totals             229.3      224.9      244.9         8.9%
                           Tons per            11.5       10.2        8.7
                           employee
                           % reduction per               −12.17%    −14.46%
                           employee