
Page 149 - The Green Building Bottom Line The Real Cost of Sustainable Building
P. 149
128 CHAPTER 4
remain in the market. Certainly, as it becomes more common for developers to create
green real estate portfolios, the value-enhancement opportunity diminishes—to the
point where it becomes a liability if a development company owns a non-green real
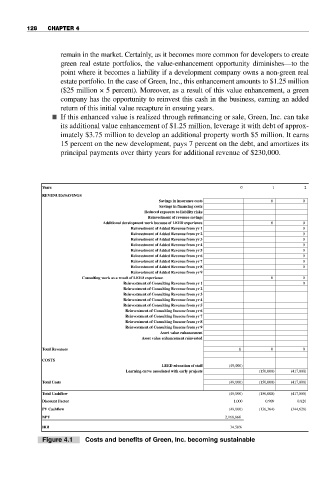
estate portfolio. In the case of Green, Inc., this enhancement amounts to $1.25 million
($25 million × 5 percent). Moreover, as a result of this value enhancement, a green
company has the opportunity to reinvest this cash in the business, earning an added
return of this initial value recapture in ensuing years.
■ If this enhanced value is realized through refinancing or sale, Green, Inc. can take
its additional value enhancement of $1.25 million, leverage it with debt of approx-
imately $3.75 million to develop an additional property worth $5 million. It earns
15 percent on the new development, pays 7 percent on the debt, and amortizes its
principal payments over thirty years for additional revenue of $230,000.
Y Years 0 1 2
ears
REVENUES/SA VINGS
REVENUES/SAVINGS
Savings
Savings in insurance costs 0 0
costs
in
insurance
Savings in financing costs
costs
in
Savings
financing
Reduced exposur e to liability risks
Reduced exposure to liability risks
r
Reinvestment of revenue savings
Reinvestment
evenue
savings
of
Additional development work because of LEED experience
Additional development work because of LEED experience 0 0
of
om
Added
Revenue
Reinvestment
Reinvestment of Added Revenue from yr 11 0
yr
fr
Reinvestment of Added Revenue from yr 22 0
Revenue
yr
fr
Reinvestment
Added
of
om
Reinvestment of Added Revenue fr om yr 0
Reinvestment of Added Revenue from yr 33
Reinvestment of Added Revenue fr om yr 0
Reinvestment of Added Revenue from yr 44
Reinvestment of Added Revenue from yr 55
Reinvestment of Added Revenue fr om yr 0
Reinvestment of Added Revenue fr om yr 0
Reinvestment of Added Revenue from yr 66
Reinvestment of Added Revenue from yr 77
Reinvestment of Added Revenue fr om yr 0
Reinvestment of Added Revenue from yr 88 0
Reinvestment
Revenue
of
om
yr
fr
Added
Reinvestment of Added Revenue from yr 99
Reinvestment of Added Revenue fr om yr
a
work
as
LEED
experience
Consulting work as a result of LEED experience 0 0
of
r
esult
Consulting
Reinvestment of Consulting Revenue fr om yr 0
Reinvestment of Consulting Revenue from yr 11
Reinvestment of Consulting Revenue fr om yr
Reinvestment of Consulting Revenue from yr 22
Reinvestment of Consulting Revenue from yr 33
Reinvestment of Consulting Revenue fr om yr
Reinvestment of Consulting Revenue fr om yr
Reinvestment of Consulting Revenue from yr 44
Reinvestment of Consulting Revenue from yr 55
Reinvestment of Consulting Revenue fr om yr
Income
Reinvestment
Reinvestment of Consulting Income from yryr 66
fr
of
om
Consulting
Reinvestment of Consulting Income fr om
Reinvestment of Consulting Income from yryr 77
Reinvestment of Consulting Income from yryr 88
Income
fr
om
of
Consulting
Reinvestment
fr
Consulting
Income
om
Reinvestment of Consulting Income from yryr 99
Reinvestment
of
Asset value enhancement
Asset value enhancement
r
einvested
Asset
value
Asset value enhancement reinvested
enhancement
Total Revenuesotal Revenues 0 0 0
COSTS
COSTS
education
(49,000)
of
staff
LEED
LEED education of staff (49,000)
(150,000)
Learning curve associated with early projects
(417,000)
Learning curve associated with early pr ojects (150,000) (417,000)
Total Costsotal Costs (49,000) (150,000) (417,000)
(150,000)
(417,000)
(49,000)
(417,000)
(49,000)
(150,000)
Total Cashflowotal Cashflow (49,000) (150,000) (417,000)
0.909
1.000
Discount Factor
Discount Factor 1.000 0.909 0.826
0.826
(136,364)
Cashflow
PV
PV Cashflow (49,000) (136,364) (344,628)
(344,628)
(49,000)
NPV 2,168,868
2,168,868
NPV
34.50%
IRR 34.50%
IRR
Figure 4.1 Costs and benefits of Green, Inc. becoming sustainable