
Page 151 - The Green Building Bottom Line The Real Cost of Sustainable Building
P. 151
130 CHAPTER 4
ears
Y Years 0 1 2 3
REVENUES
REVENUES
Shaping values, chapter 1 21,300 21,300 21,300
21,300
Shaping values, chapter 1
21,300
21,300
Creating a culture of grreen glue, chapter 2 2 79,000 79,000 79,000
79,000
glue,
chapter
eo
eating
fg
79,000
79,000
een
a
cultur
om
chapter
inside
Green from the inside out, chapter 3 3 3,300 3,300 3,300
the
out,
een
fr
3,300
3,300
3,300
Developing expertise in LEED, chapter 4
Developing expertise in LEED, chapter 4 0 0 0 0
Sale of Green, Inc.
Sale of Gr een, Inc.
103,600
Total Revenues 103,600 103,600 103,600
103,600
otal
103,600
Revenues
EXPENSES
EXPENSES
Shaping values, chapter 1 (166,000) (1 (114,500) (91,875) (97,286)
(166,000)
(91,875)
Shaping values, chapter 1
14,500)
(97,286)
a
eo
eating
(57,600)
chapter
(72,717)
(64,631)
glue,
Creating a culture of grreen glue, chapter 2 2 0 (57,600) (64,631) (72,717)
cultur
een
fg
(78,490)
(22,381)
(22,998)
chapter
the
inside
out,
een
Green from the inside out, chapter 3 3 0 (78,490) (22,381) (22,998)
fr
om
in
(49,000)
(150,000)
LEED,
(417,000)
Developing expertise in LEED, chapter 4 4 (49,000) (150,000) (417,000) (890,000)
Developing
expertise
(890,000)
chapter
(400,590)
(215,000)
(1,083,002)
Total Expenses (215,000) (400,590) (595,888) (1,083,002)
otal
Expenses
(595,888)
(492,288)
Cashflow
(296,990)
(979,402)
Total Cashflow (215,000) (296,990) (492,288) (979,402)
otal
(215,000)
0.909
Discount
Factor
Discount Factor 1.000 0.909 0.826 0.751
0.826
0.751
1.000
(406,849)
(735,839)
PV
Cashflow
(269,991)
(215,000)
PV Cashflow (215,000) (269,991) (406,849) (735,839)
NPV
2,300,994
NPV 2,300,994
IRR
28.38%
IRR 28.38%
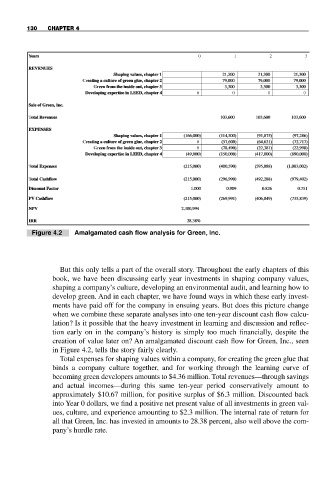
Figure 4.2 Amalgamated cash flow analysis for Green, Inc.
But this only tells a part of the overall story. Throughout the early chapters of this
book, we have been discussing early year investments in shaping company values,
shaping a company’s culture, developing an environmental audit, and learning how to
develop green. And in each chapter, we have found ways in which these early invest-
ments have paid off for the company in ensuing years. But does this picture change
when we combine these separate analyses into one ten-year discount cash flow calcu-
lation? Is it possible that the heavy investment in learning and discussion and reflec-
tion early on in the company’s history is simply too much financially, despite the
creation of value later on? An amalgamated discount cash flow for Green, Inc., seen
in Figure 4.2, tells the story fairly clearly.
Total expenses for shaping values within a company, for creating the green glue that
binds a company culture together, and for working through the learning curve of
becoming green developers amounts to $4.36 million. Total revenues—through savings
and actual incomes—during this same ten-year period conservatively amount to
approximately $10.67 million, for positive surplus of $6.3 million. Discounted back
into Year 0 dollars, we find a positive net present value of all investments in green val-
ues, culture, and experience amounting to $2.3 million. The internal rate of return for
all that Green, Inc. has invested in amounts to 28.38 percent, also well above the com-
pany’s hurdle rate.