
Page 153 - The Green Building Bottom Line The Real Cost of Sustainable Building
P. 153
132 CHAPTER 4
capital annually that—had we accepted—would have had us developing real estate port-
folios every year equal to or greater than the size of the one portfolio we have spent the
last seventy years creating! We declined, simply viewing this type of growth as not in
keeping with our sustainable, slow-growth ethos. Nevertheless, we do have access to
capital that we did not have before. The value of this? Hard to say. We don’t have to spin
our wheels in time (and money) trying to match a deal with capital. We have the oppor-
tunity to choose those projects that best leverage and complement our team’s skill set.
Another aspect of longer-term, intangible value creation concerns the enhancement
of a company’s name and reputation. It’s there, I can feel it. But how do you put a
value on it? Sometimes, in quiet or down-time moments with the company (moments
that don’t happen all that frequently by the way), I wonder how much Melaver, Inc.
would sell for on the open market. Who knows? The sales of companies with kindred
spirits—Ben and Jerry’s to Unilever, Stonyfield Farms to Danone, Tom’s of Maine to
Colgate-Palmolive—are few and far between, the documentation sparse on the pre-
mium paid for such companies’ brand, reputation, and goodwill.
We could, I suppose, do a back-of-the-envelope analysis, drawing upon some of the
revenue/savings calculations in this and previous chapters in our discussion of Green,
Inc. In our analysis of that fictionalized company, we felt comfortable with the fol-
lowing projections:
■ Additional business development of $450,000 annually because of values orienta-
tion (Chapter 1).
■ Additional business development of another $450,000 annually due to knowledge
of and experience with LEED processes and construction.
■ Additional consulting revenue of $150,000 annually.
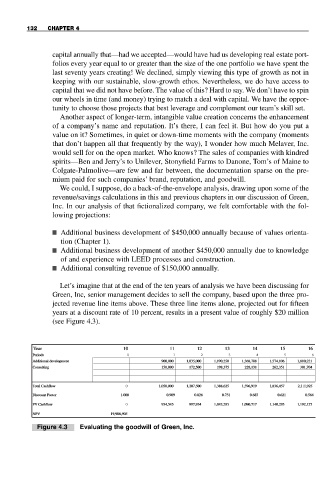
Let’s imagine that at the end of the ten years of analysis we have been discussing for
Green, Inc, senior management decides to sell the company, based upon the three pro-
jected revenue line items above. These three line items alone, projected out for fifteen
years at a discount rate of 10 percent, results in a present value of roughly $20 million
(see Figure 4.3).
Y Year 10 11 12 13 14 15 16
ear
10
12
14
15
16
13
Periods 0 1 2 3 4 5 6
Periods
900,000
1,035,000
1,574,106
1,368,788
1,190,250
1,810,221
Additional development
Additional development 900,000 1,035,000 1,190,250 1,368,788 1,574,106 1,810,221
Consulting 150,000 172,500 198,375 228,131 262,351 301,704
262,351
Consulting
172,500
150,000
198,375
301,704
228,131
1,596,919
1,388,625
Total Cashflowotal Cashflow 0 1,050,000 1,207,500 1,388,625 1,596,919 1,836,457 2,1 1,925
2,111,925
1,050,000
1,836,457
1,207,500
Discount Factor 1.000 0.909 0.826 0.751 0.683 0.621 0.564
0.564
0.683
0.621
1.000
0.909
0.826
Factor
0.751
Discount
954,545
PV CashflowCashflow
1,192,127
PV 0 954,545 997,934 1,043,295 1,090,717 1,140,295 1,192,127
997,934
1,043,295
1,090,717
1,140,295
19,906,905
NPV 19,906,905
NPV
Figure 4.3 Evaluating the goodwill of Green, Inc.