
Page 51 - The Green Building Bottom Line The Real Cost of Sustainable Building
P. 51
30 CHAPTER 1
Y Years 0 1 2 3
ears
COSTS
COSTS
(150,000)
Opportunity
Lost
(3,61
(22,500)
(3,375)
Lost Opportunity (150,000) (22,500) (3,375) (3,611)
1)
(16,000)
Facilitator
Facilitator (16,000)
Sub-total Costs (166,000) (22,500) (3,375) (3,61 1)
(22,500)
(3,611)
(166,000)
(3,375)
Sub-total Costs
(22,500)
(3,375)
Total Cashflowotal Cashflow (166,000) (22,500) (3,375) (3,61 1)
(166,000)
(3,611)
0.909
0.826
1.000
0.751
Discount Factor 1.000 0.909 0.826 0.751
Discount Factor
PV
(166,000)
PV Cashflow (166,000) (20,455) (2,789) (2,713)
(2,789)
(20,455)
Cashflow
(2,713)
NPV (208,987)
NPV
(208,987)
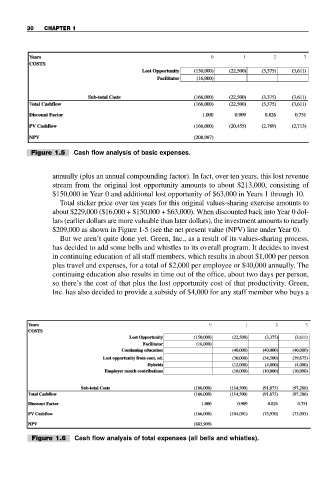
Figure 1.5 Cash flow analysis of basic expenses.
annually (plus an annual compounding factor). In fact, over ten years, this lost revenue
stream from the original lost opportunity amounts to about $213,000, consisting of
$150,000 in Year 0 and additional lost opportunity of $63,000 in Years 1 through 10.
Total sticker price over ten years for this original values-sharing exercise amounts to
about $229,000 ($16,000 + $150,000 + $63,000). When discounted back into Year 0 dol-
lars (earlier dollars are more valuable than later dollars), the investment amounts to nearly
$209,000 as shown in Figure 1-5 (see the net present value (NPV) line under Year 0).
But we aren’t quite done yet. Green, Inc., as a result of its values-sharing process,
has decided to add some bells and whistles to its overall program. It decides to invest
in continuing education of all staff members, which results in about $1,000 per person
plus travel and expenses, for a total of $2,000 per employee or $40,000 annually. The
continuing education also results in time out of the office, about two days per person,
so there’s the cost of that plus the lost opportunity cost of that productivity. Green,
Inc. has also decided to provide a subsidy of $4,000 for any staff member who buys a
Y Years 0 1 2 3
ears
COSTS
COSTS
1)
(22,500)
(150,000)
Lost
Opportunity
Lost Opportunity (150,000) (22,500) (3,375) (3,611)
(3,375)
(3,61
Facilitator (16,000)
(16,000)
Facilitator
Continuing education
Continuing education (40,000) (40,000) (40,000)
(40,000)
(40,000)
(40,000)
Lost opportunity from cont. ed.
Lost opportunity fr om cont. ed. (30,000) (34,500) (39,675)
(34,500)
(39,675)
(30,000)
(4,000)
(4,000)
(12,000)
Hybrids (12,000) (4,000) (4,000)
Hybrids
(10,000)
match
(10,000)
Employer match contributionscontributions (10,000) (10,000) (10,000)
Employer
(10,000)
Costs
14,500)
(97,286)
Sub-total Costs (166,000) (1 (114,500) (91,875) (97,286)
Sub-total
(91,875)
(166,000)
Total Cashflowotal Cashflow (166,000) (1 (114,500) (91,875) (97,286)
(97,286)
(166,000)
14,500)
(91,875)
Discount Factor 1.000 0.909 0.826 0.751
Discount Factor
0.751
0.826
0.909
1.000
PV (166,000) (104,091) (75,930) (73,093)
(73,093)
PV CashflowCashflow
(75,930)
(104,091)
(166,000)
(883,909)
NPV
NPV (883,909)
Figure 1.6 Cash flow analysis of total expenses (all bells and whistles).