
Page 56 - The Green Building Bottom Line The Real Cost of Sustainable Building
P. 56
NARRATING VALUES, SHAPING VALUES, CREATING VALUE 35
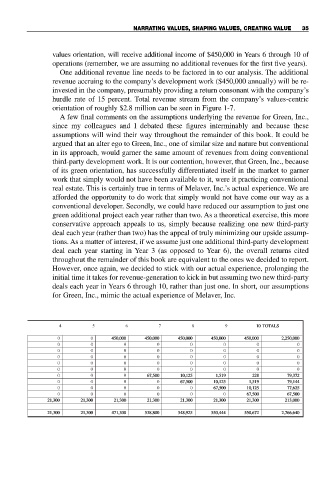
values orientation, will receive additional income of $450,000 in Years 6 through 10 of
operations (remember, we are assuming no additional revenues for the first five years).
One additional revenue line needs to be factored in to our analysis. The additional
revenue accruing to the company’s development work ($450,000 annually) will be re-
invested in the company, presumably providing a return consonant with the company’s
hurdle rate of 15 percent. Total revenue stream from the company’s values-centric
orientation of roughly $2.8 million can be seen in Figure 1-7.
A few final comments on the assumptions underlying the revenue for Green, Inc.,
since my colleagues and I debated these figures interminably and because these
assumptions will wind their way throughout the remainder of this book. It could be
argued that an alter ego to Green, Inc., one of similar size and nature but conventional
in its approach, would garner the same amount of revenues from doing conventional
third-party development work. It is our contention, however, that Green, Inc., because
of its green orientation, has successfully differentiated itself in the market to garner
work that simply would not have been available to it, were it practicing conventional
real estate. This is certainly true in terms of Melaver, Inc.’s actual experience. We are
afforded the opportunity to do work that simply would not have come our way as a
conventional developer. Secondly, we could have reduced our assumption to just one
green additional project each year rather than two. As a theoretical exercise, this more
conservative approach appeals to us, simply because realizing one new third-party
deal each year (rather than two) has the appeal of truly minimizing our upside assump-
tions. As a matter of interest, if we assume just one additional third-party development
deal each year starting in Year 3 (as opposed to Year 6), the overall returns cited
throughout the remainder of this book are equivalent to the ones we decided to report.
However, once again, we decided to stick with our actual experience, prolonging the
initial time it takes for revenue-generation to kick in but assuming two new third-party
deals each year in Years 6 through 10, rather than just one. In short, our assumptions
for Green, Inc., mimic the actual experience of Melaver, Inc.
4 4 5 6 7 8 9 10 TOTALS
ALS
OT
10
450,000
0 0 450,000 450,000 450,000 450,000 450,000 2,250,000
2,250,000
450,000
450,000
450,000
450,000
0 0 0 0 0 0 0 0
0 0 0 0 0 0 0 0
0 0 0 0 0 0 0 0
0 0 0 0 0 0 0 0
0 0 0 0 0 0 0 0
67,500
10,125
1,519
79,372
0 0 0 67,500 10,125 1,519 228 79,372
228
79,144
10,125
1,519
67,500
0 0 0 0 67,500 10,125 1,519 79,144
67,500
10,125
0 0 0 0 0 67,500 10,125 77,625
77,625
67,500
0 0 0 0 0 0 67,500 67,500
67,500
21,300
21,300
213,000
21,300
21,300
21,300
21,300
21,300
21,300 21,300 21,300 21,300 21,300 21,300 21,300 213,000
538,800
550,672
548,925
471,300
21,300 21,300 471,300 538,800 548,925 550,444 550,672 2,766,640
21,300
21,300
2,766,640
550,444