Page 57 - The Green Building Bottom Line The Real Cost of Sustainable Building
P. 57

36  CHAPTER 1


                     ASSEMBLING THE DATA
                     Now let’s assemble the various data. We started with a fictionalized company, Green,
                     Inc., which closely resembles Melaver, Inc. We looked at the various first costs associ-
                     ated with shaping the company’s values as well as the carryover costs associated with
                     the development of various programs that support those values. We then turned our
                     attention to value creation. We limited this value creation to the last five years of a ten-
                     year analysis on the assumption that it would take a significant amount of time before
                     beliefs translated into practices that would accrue to the bottom line. We further limited
                     this value creation by including only those elements we could link directly to the values
                     orientation of the company—employee retention and additional development work. All
                     of the numbers and assumptions utilized throughout this analysis are based on actual
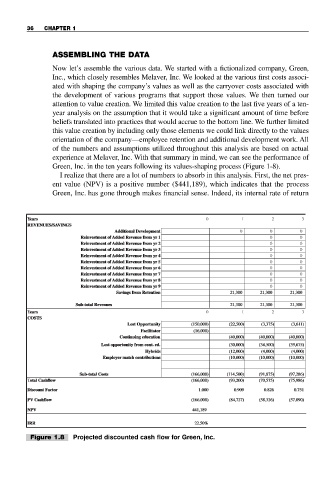
                     experience at Melaver, Inc. With that summary in mind, we can see the performance of
                     Green, Inc. in the ten years following its values-shaping process (Figure 1-8).
                       I realize that there are a lot of numbers to absorb in this analysis. First, the net pres-
                     ent value (NPV) is a positive number ($441,189), which indicates that the process
                     Green, Inc. has gone through makes financial sense. Indeed, its internal rate of return


              Y Years                                           0         1       2        3
               ears
              REVENUES/SAVINGS
              REVENUES/SA VINGS
                                      Additional
                                            Development
                                      Additional Development              0       0       0
                             Reinvestment of  Added  Revenue  fr om yr  1         0       0
                             Reinvestment of Added Revenue from yr 1
                             Reinvestment of Added Revenue from yr 2
                             Reinvestment  of  Added  Revenue  fr om  yr  2       0       0
                             Reinvestment of Added Revenue from yr 3 3            0       0
                                         Revenue
                                              fr
                                    of
                             Reinvestment
                                      Added
                                                 yr
                                               om
                             Reinvestment of Added Revenue from yr 4 4            0       0
                                      Added
                                         Revenue
                                              fr
                                                 yr
                                    of
                                               om
                             Reinvestment
                             Reinvestment
                                    of
                                               om
                                      Added
                             Reinvestment of Added Revenue from yr 5 5            0       0
                                         Revenue
                                                 yr
                                              fr
                             Reinvestment of Added Revenue from yr 6
                             Reinvestment of  Added  Revenue  fr om yr  6         0       0
                                              fr
                                               om
                                    of
                                         Revenue
                             Reinvestment
                                      Added
                                                 yr
                             Reinvestment of Added Revenue from yr 7 7            0       0
                                      Added
                                         Revenue
                                    of
                                                 yr
                             Reinvestment
                             Reinvestment of Added Revenue from yr 8 8            0       0
                                              fr
                                               om
                                      Added
                                               om
                                              fr
                                         Revenue
                             Reinvestment of Added Revenue from yr 9 9            0       0
                             Reinvestment
                                    of
                                                 yr
                                              Retention
                                                                       21,300
                                            om
                                                                                        21,300
                                                                               21,300
                                           fr
                                       Savings
                                       Savings from Retention          21,300  21,300   21,300
                           Sub-total Revenues
                           Sub-total  Revenues                         21,300  21,300   21,300
                                                                                        21,300
                                                                       21,300
                                                                               21,300
              Years                                             0         1       2        3
               ears
              COSTS
              COSTS
                                          Lost Opportunity
                                                                                          1)
                                                                                        (3,61
                                                                               (3,375)
                                                                      (22,500)
                                                            (150,000)
                                          Lost  Opportunity  (150,000)  (22,500)  (3,375)  (3,611)
                                              Facilitator   (16,000)
                                              Facilitator
                                                            (16,000)
                                                                      (40,000)
                                              education
                                                                                       (40,000)
                                        Continuing education          (40,000)  (40,000)  (40,000)
                                                                               (40,000)
                                        Continuing
                                                                               (34,500)
                                   Lost opportunity from cont. ed.
                                   Lost  opportunity  fr om  cont.  ed.  (30,000)  (34,500)  (39,675)
                                                                                       (39,675)
                                                                      (30,000)
                                               Hybrids
                                               Hybrids                (12,000)  (4,000)  (4,000)
                                                                      (12,000)
                                                                                        (4,000)
                                                                               (4,000)
                                                                      (10,000)
                                   Employer match contributions
                                                                                       (10,000)
                                   Employer  match  contributions     (10,000)  (10,000)  (10,000)
                                                                               (10,000)
                                                                       14,500)
                                                                               (91,875)
                                                                                       (97,286)
                            Sub-total Costs                 (166,000)  (1 (114,500)  (91,875)  (97,286)
                                                            (166,000)
                            Sub-total
                                  Costs
                                                                                       (75,986)
              Total Cashflowotal Cashflow                   (166,000)  (93,200)  (70,575)  (75,986)
                                                                               (70,575)
                                                                      (93,200)
                                                            (166,000)
              Discount Factor
                                                                                         0.751
                                                              1.000
                                                                        0.909
              Discount  Factor                                1.000     0.909   0.826    0.751
                                                                                0.826
                                                                      (84,727)
                                                                                       (57,090)
                Cashflow
                                                                               (58,326)
                                                            (166,000)
              PV
              PV Cashflow                                   (166,000)  (84,727)  (58,326)  (57,090)
              NPV                                           441,189
              NPV
                                                            441,189
              IRR
              IRR                                            22.50%
                                                             22.50%
               Figure 1.8  Projected discounted cash flow for Green, Inc.
   52   53   54   55   56   57   58   59   60   61   62