
Page 55 - The Green Building Bottom Line The Real Cost of Sustainable Building
P. 55
34 CHAPTER 1
In addition to realizing savings through greater employee retention, Green, Inc. also
will see increased revenues by additional development work. At our own company
today, we vet around ten potential third-party development deals each year where we
have been directly sought out by an owner because of our values-oriented reputation
and our sustainable practices. In 2007 alone, we selected four such projects to develop
for others, each providing us with a development fee of 4 percent. In the interest of
being conservative, let’s consider only two of those projects, costing $15 million each
and providing gross income of about $1.2 million ($30,000,000 × 4% = $1,200,000).
Granted, there are costs associated with these projects, mostly the cost of labor in
overseeing things from start to finish. Moreover, it’s difficult to say to what extent we
are being approached because of our values-orientation per se versus our experience
in developing sustainably. Clearly, if we lacked sustainable development experience,
we would not have been considered in the first place. However, while this experience
has been a driver in being invited to make a proposal to potential clients, it is the way
in which our staff members conduct themselves during the selection process—the
way we engage with ourselves and others, the care we take to listen, the way in which
we transmit our people-oriented values to a potential client—that closes the deal.
Conversely, we won’t accept a development deal if we feel there isn’t a strong con-
vergence of our values and those of our potential client.
Again, for the sake of being conservative, let’s say that of the 4 percent development
fee we receive on any one of these projects, a quarter (25 percent) of it is eaten up by
the cost of labor and time, thus reducing it to 3 percent net income ($900,000). Let’s also
say that of the 3 percent net fee, fully half of it is attributable to our experience with sus-
tainable development with the other half ($450,000) attributable to our values orienta-
tion. Finally, let’s assume that 2007 was something of an anomaly in doing four such
projects and that in future years, Green, Inc. will be successful in garnering only two
$15 million development projects each year. In short, Green, Inc., as a direct result of its
Y Years 0 1 2 3
ears
REVENUES/SA VINGS
REVENUES/SAVINGS
Development
Additional Development 0 0 0
Additional
Revenue
om
yr
of
Added
Reinvestment
Reinvestment of Added Revenue from yr 11 0 0
fr
yr
of
fr
Reinvestment
Revenue
Reinvestment of Added Revenue from yr 22 0 0
Added
om
Reinvestment of Added Revenue fr om yr 0 0
Reinvestment of Added Revenue from yr 33
om
yr
Reinvestment of Added Revenue from yr 44 0 0
Added
Reinvestment
of
fr
Revenue
Reinvestment
Reinvestment of Added Revenue from yr 55 0 0
yr
Revenue
fr
om
Added
of
Reinvestment of Added Revenue from yr 66
Reinvestment of Added Revenue fr om yr 0 0
Revenue
yr
om
Reinvestment
Reinvestment of Added Revenue from yr 77 0 0
Added
fr
of
yr
fr
om
of
Added
Reinvestment
Reinvestment of Added Revenue from yr 88 0 0
Revenue
Reinvestment
Reinvestment of Added Revenue from yr 99 0 0
om
fr
yr
Revenue
of
Added
21,300
21,300
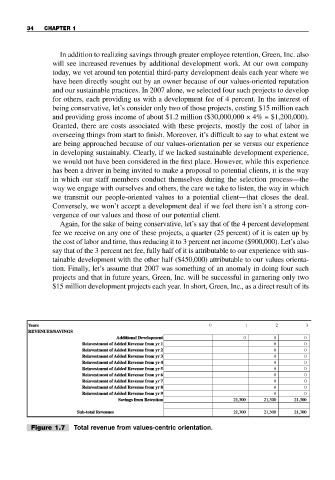
Savings fr om Retention 21,300 21,300 21,300
21,300
Savings from Retention
21,300
21,300
21,300
Sub-total Revenues 21,300 21,300 21,300
Sub-total
Revenues
Figure 1.7 Total revenue from values-centric orientation.