
Page 116 - The Handbook for Quality Management a Complete Guide to Operational Excellence
P. 116
102 I n t e g r a t e d P l a n n i n g S t r a t e g i c P l a n n i n g 103
The Strategic Implications of T, I, and OE
What makes Throughput, Inventory/Investment, and Operating Expense
even more beneficial is the strategic implications of their application by
senior managers and executives. Of course, every company executive wants
to improve net profit, return on investment, and cash flow. However, in stan-
dard accounting T, I, and OE are “embedded” in these terms and often dif-
ficult to single out, even though they are better managed separately.
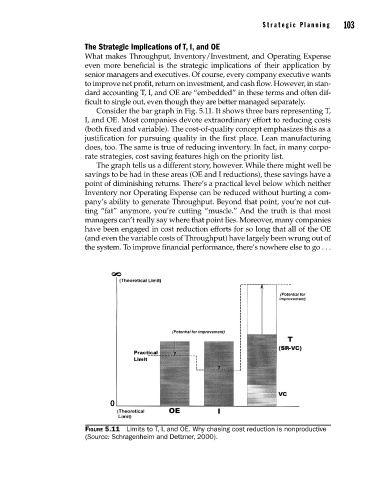
Consider the bar graph in Fig. 5.11. It shows three bars representing T,
I, and OE. Most companies devote extraordinary effort to reducing costs
(both fixed and variable). The cost-of-quality concept emphasizes this as a
justifica tion for pursuing quality in the first place. Lean manufacturing
does, too. The same is true of reducing inventory. In fact, in many corpo-
rate strategies, cost saving features high on the priority list.
The graph tells us a different story, however. While there might well be
sav ings to be had in these areas (OE and I reductions), these savings have a
point of diminishing returns. There’s a practical level below which neither
Inventory nor Operating Expense can be reduced without hurting a com-
pany’s ability to generate Throughput. Beyond that point, you’re not cut-
ting “fat” anymore, you’re cutting “muscle.” And the truth is that most
managers can’t really say where that point lies. Moreover, many companies
have been engaged in cost reduction efforts for so long that all of the OE
(and even the variable costs of Throughput) have largely been wrung out of
the system. To improve financial performance, there’s nowhere else to go . . .
Figure 5.11 Limits to T, I, and OE. Why chasing cost reduction is nonproductive
(Source: Schragenheim and Dettmer, 2000).
05_Pyzdek_Ch05_p061-102.indd 103 11/9/12 5:04 PM